


Markets Report: U.S. equities lag while other markets shine
The U.S. stock market swings sideways with marginal new highs, while other markets outperform.

U.S. equities outperformed other markets over the past 2 years. But this year, previously underperforming markets such as Chinese and European equities are outpacing U.S. equities.
Today’s Markets Report:
U.S. Equities: The upward trend remains intact; however, significant long-term concerns persist.
Chinese Equities: Exhibiting strong momentum that is somewhat overextended, thereby increasing the probability of a pullback or consolidation.
Gold and silver: Powerful momentum, could pullback/consolidate. Strong bullish narrative/theme remains intact.
Indian Equities: Positioned as the key beneficiary of the U.S.-China economic conflict. Currently underperforming as capital temporarily flows from India to China to chase the Chinese rally.
Treasury Bonds: Rallying with other markets while the U.S. Dollar is falling.
Go to the end of this blog post to see my portfolio positioning.
*All charts and data updated as of today.
U.S. Equities
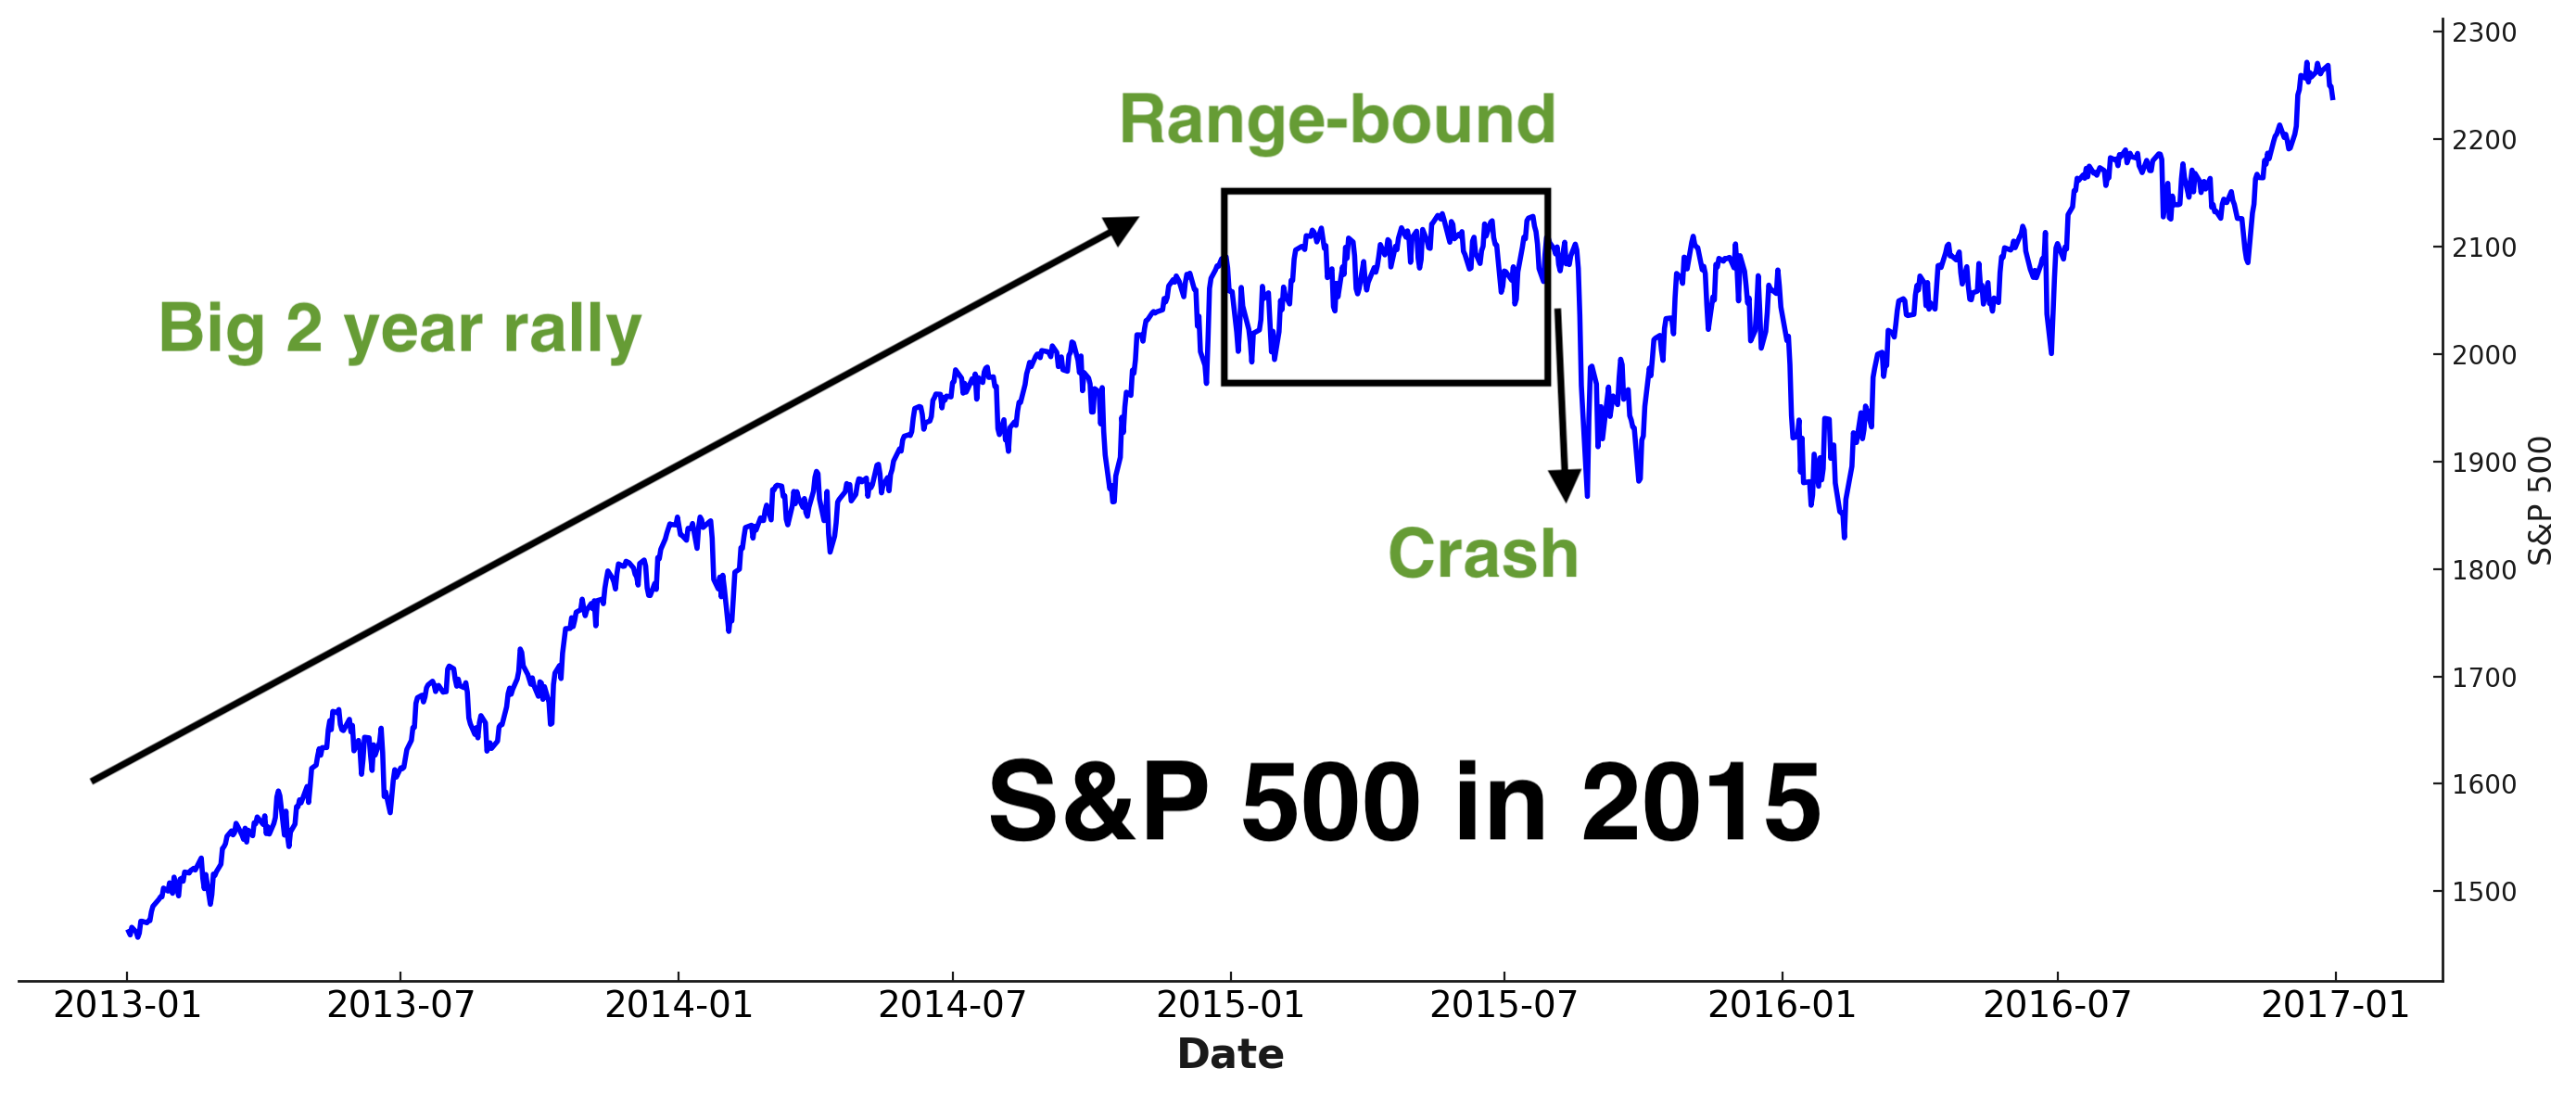
The U.S. stock market is exhibiting a pattern similar to early 2015, trading within a range following 2 years of substantial gains (2023-2024). At present, there is no significant catalyst to drive equities sharply higher or lower.
While long-term concerns persist, the intermediate outlook remains neutral, offering neither bullish nor bearish traders a clear edge.
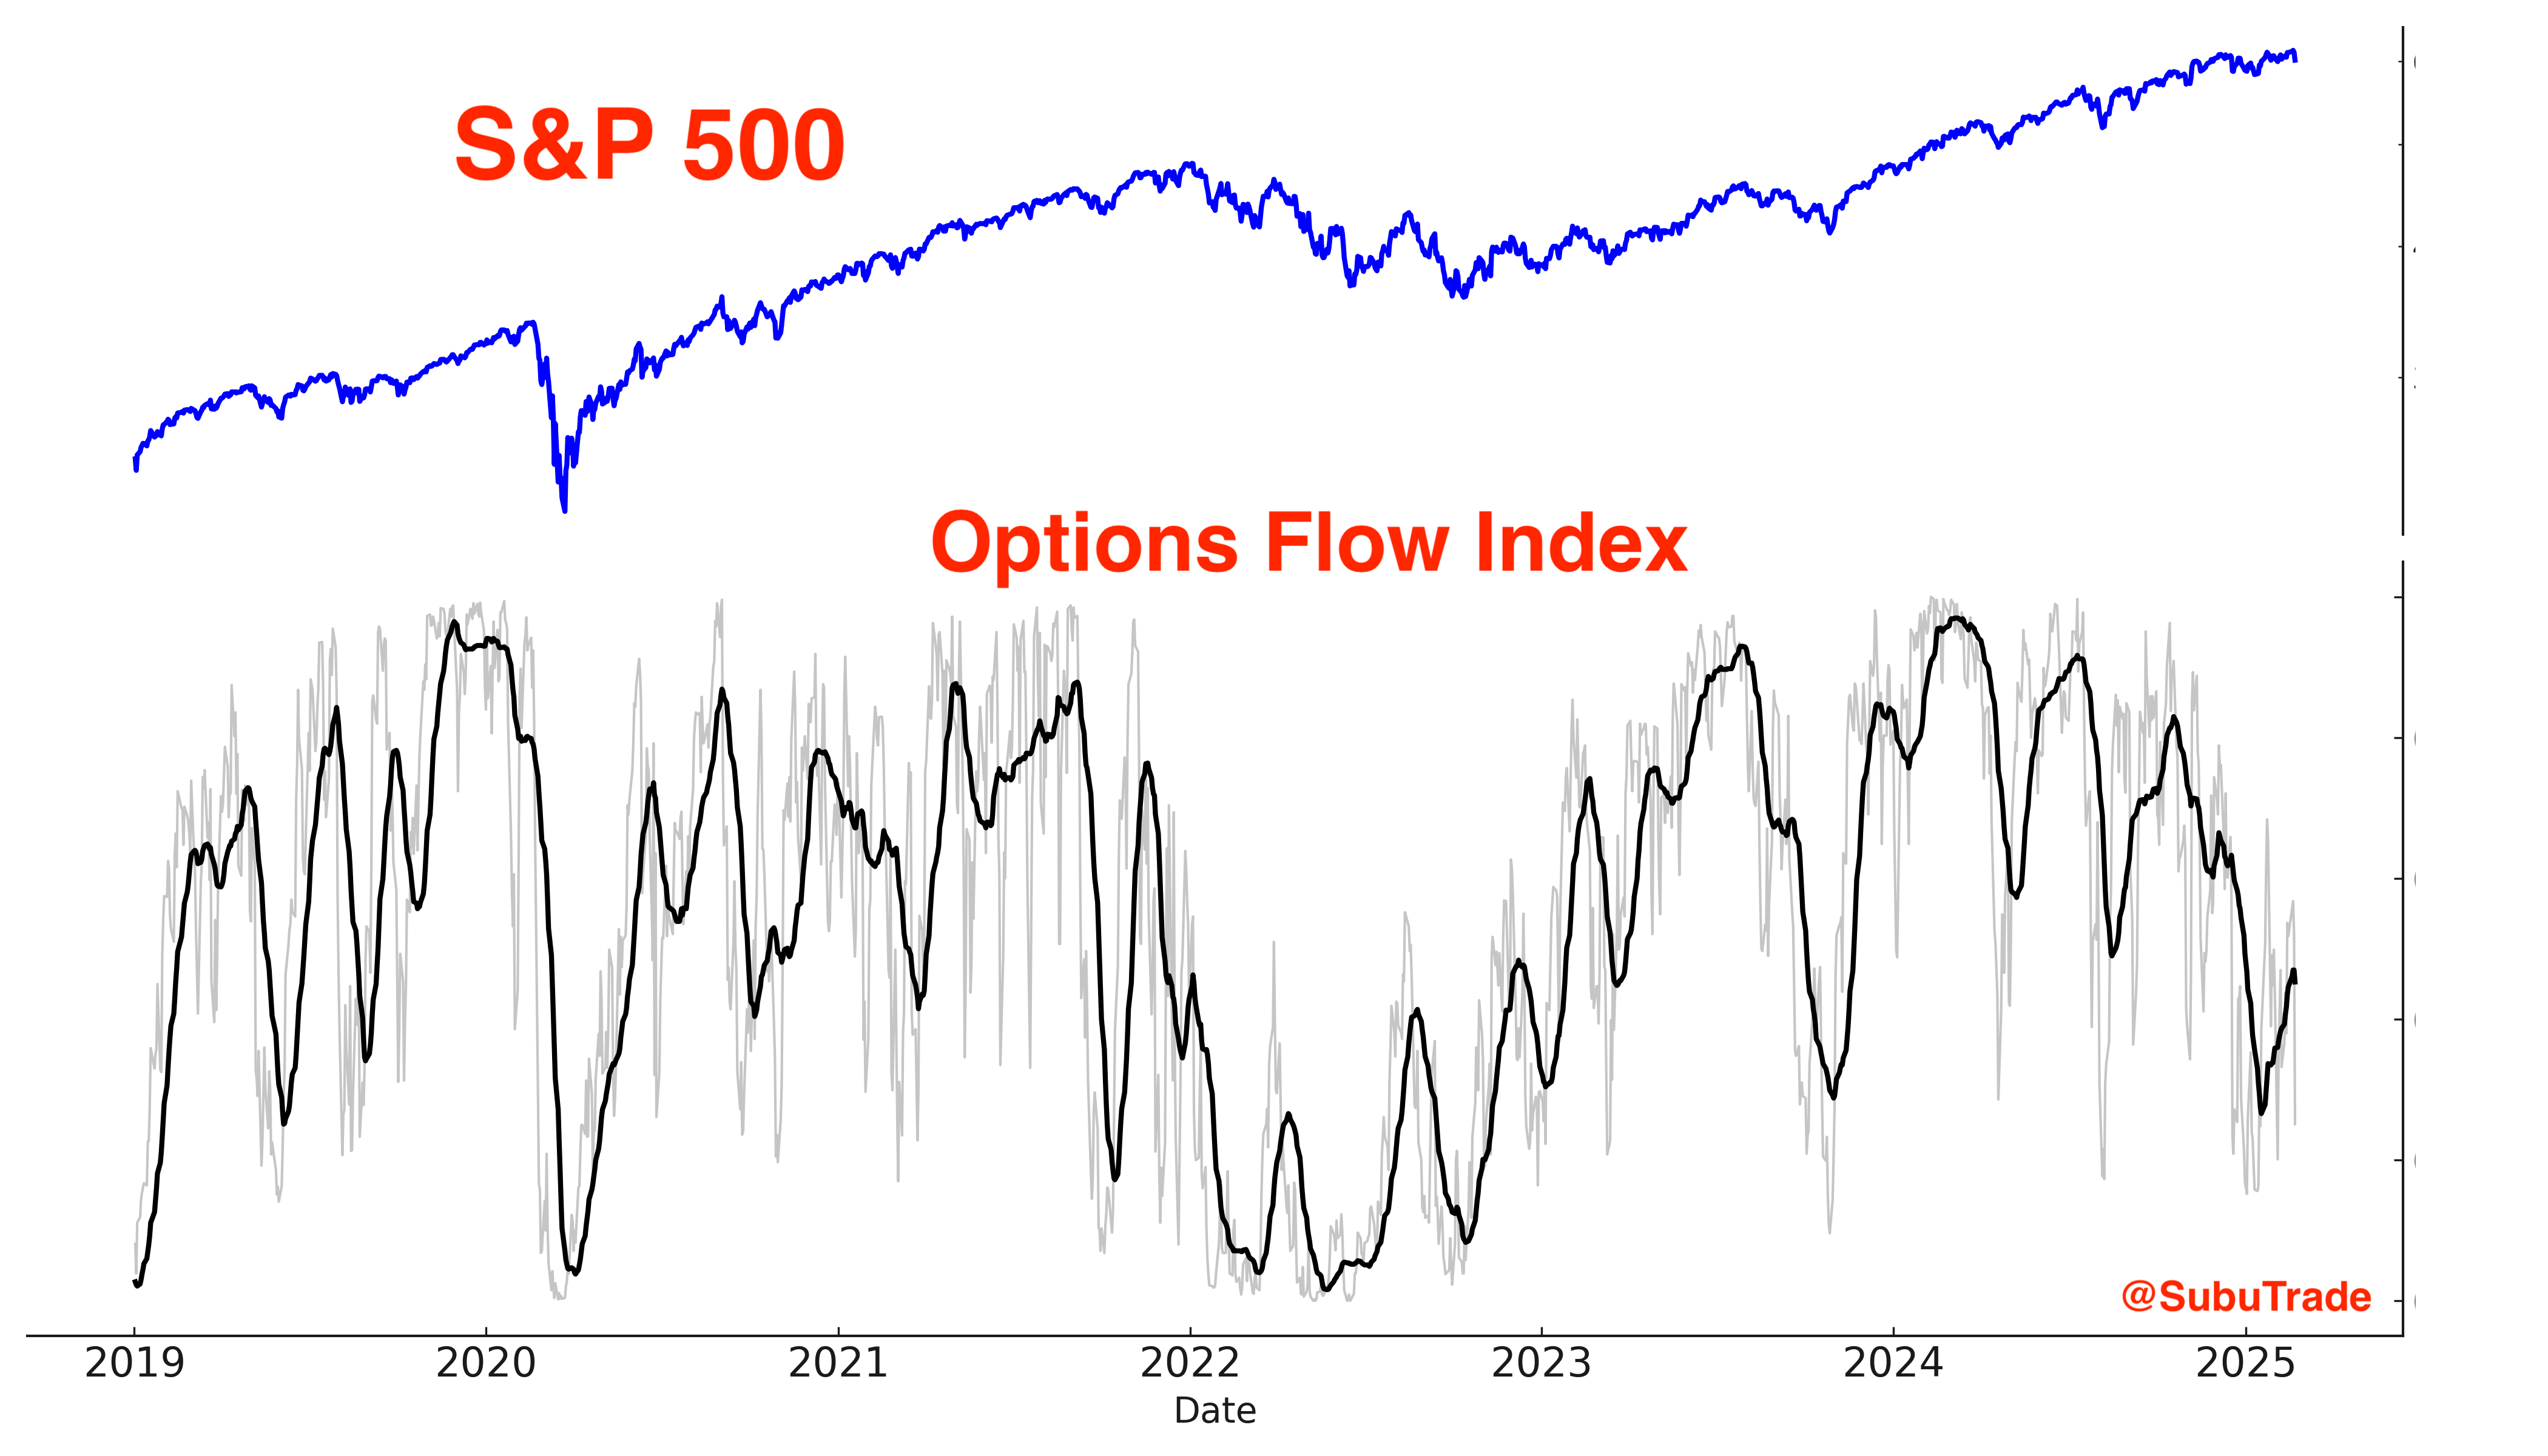
Options
The S&P 500 Options Flow Index remains in neutral territory. This short term indicator demonstrates that neither bulls nor bears have a clear short term edge right now:
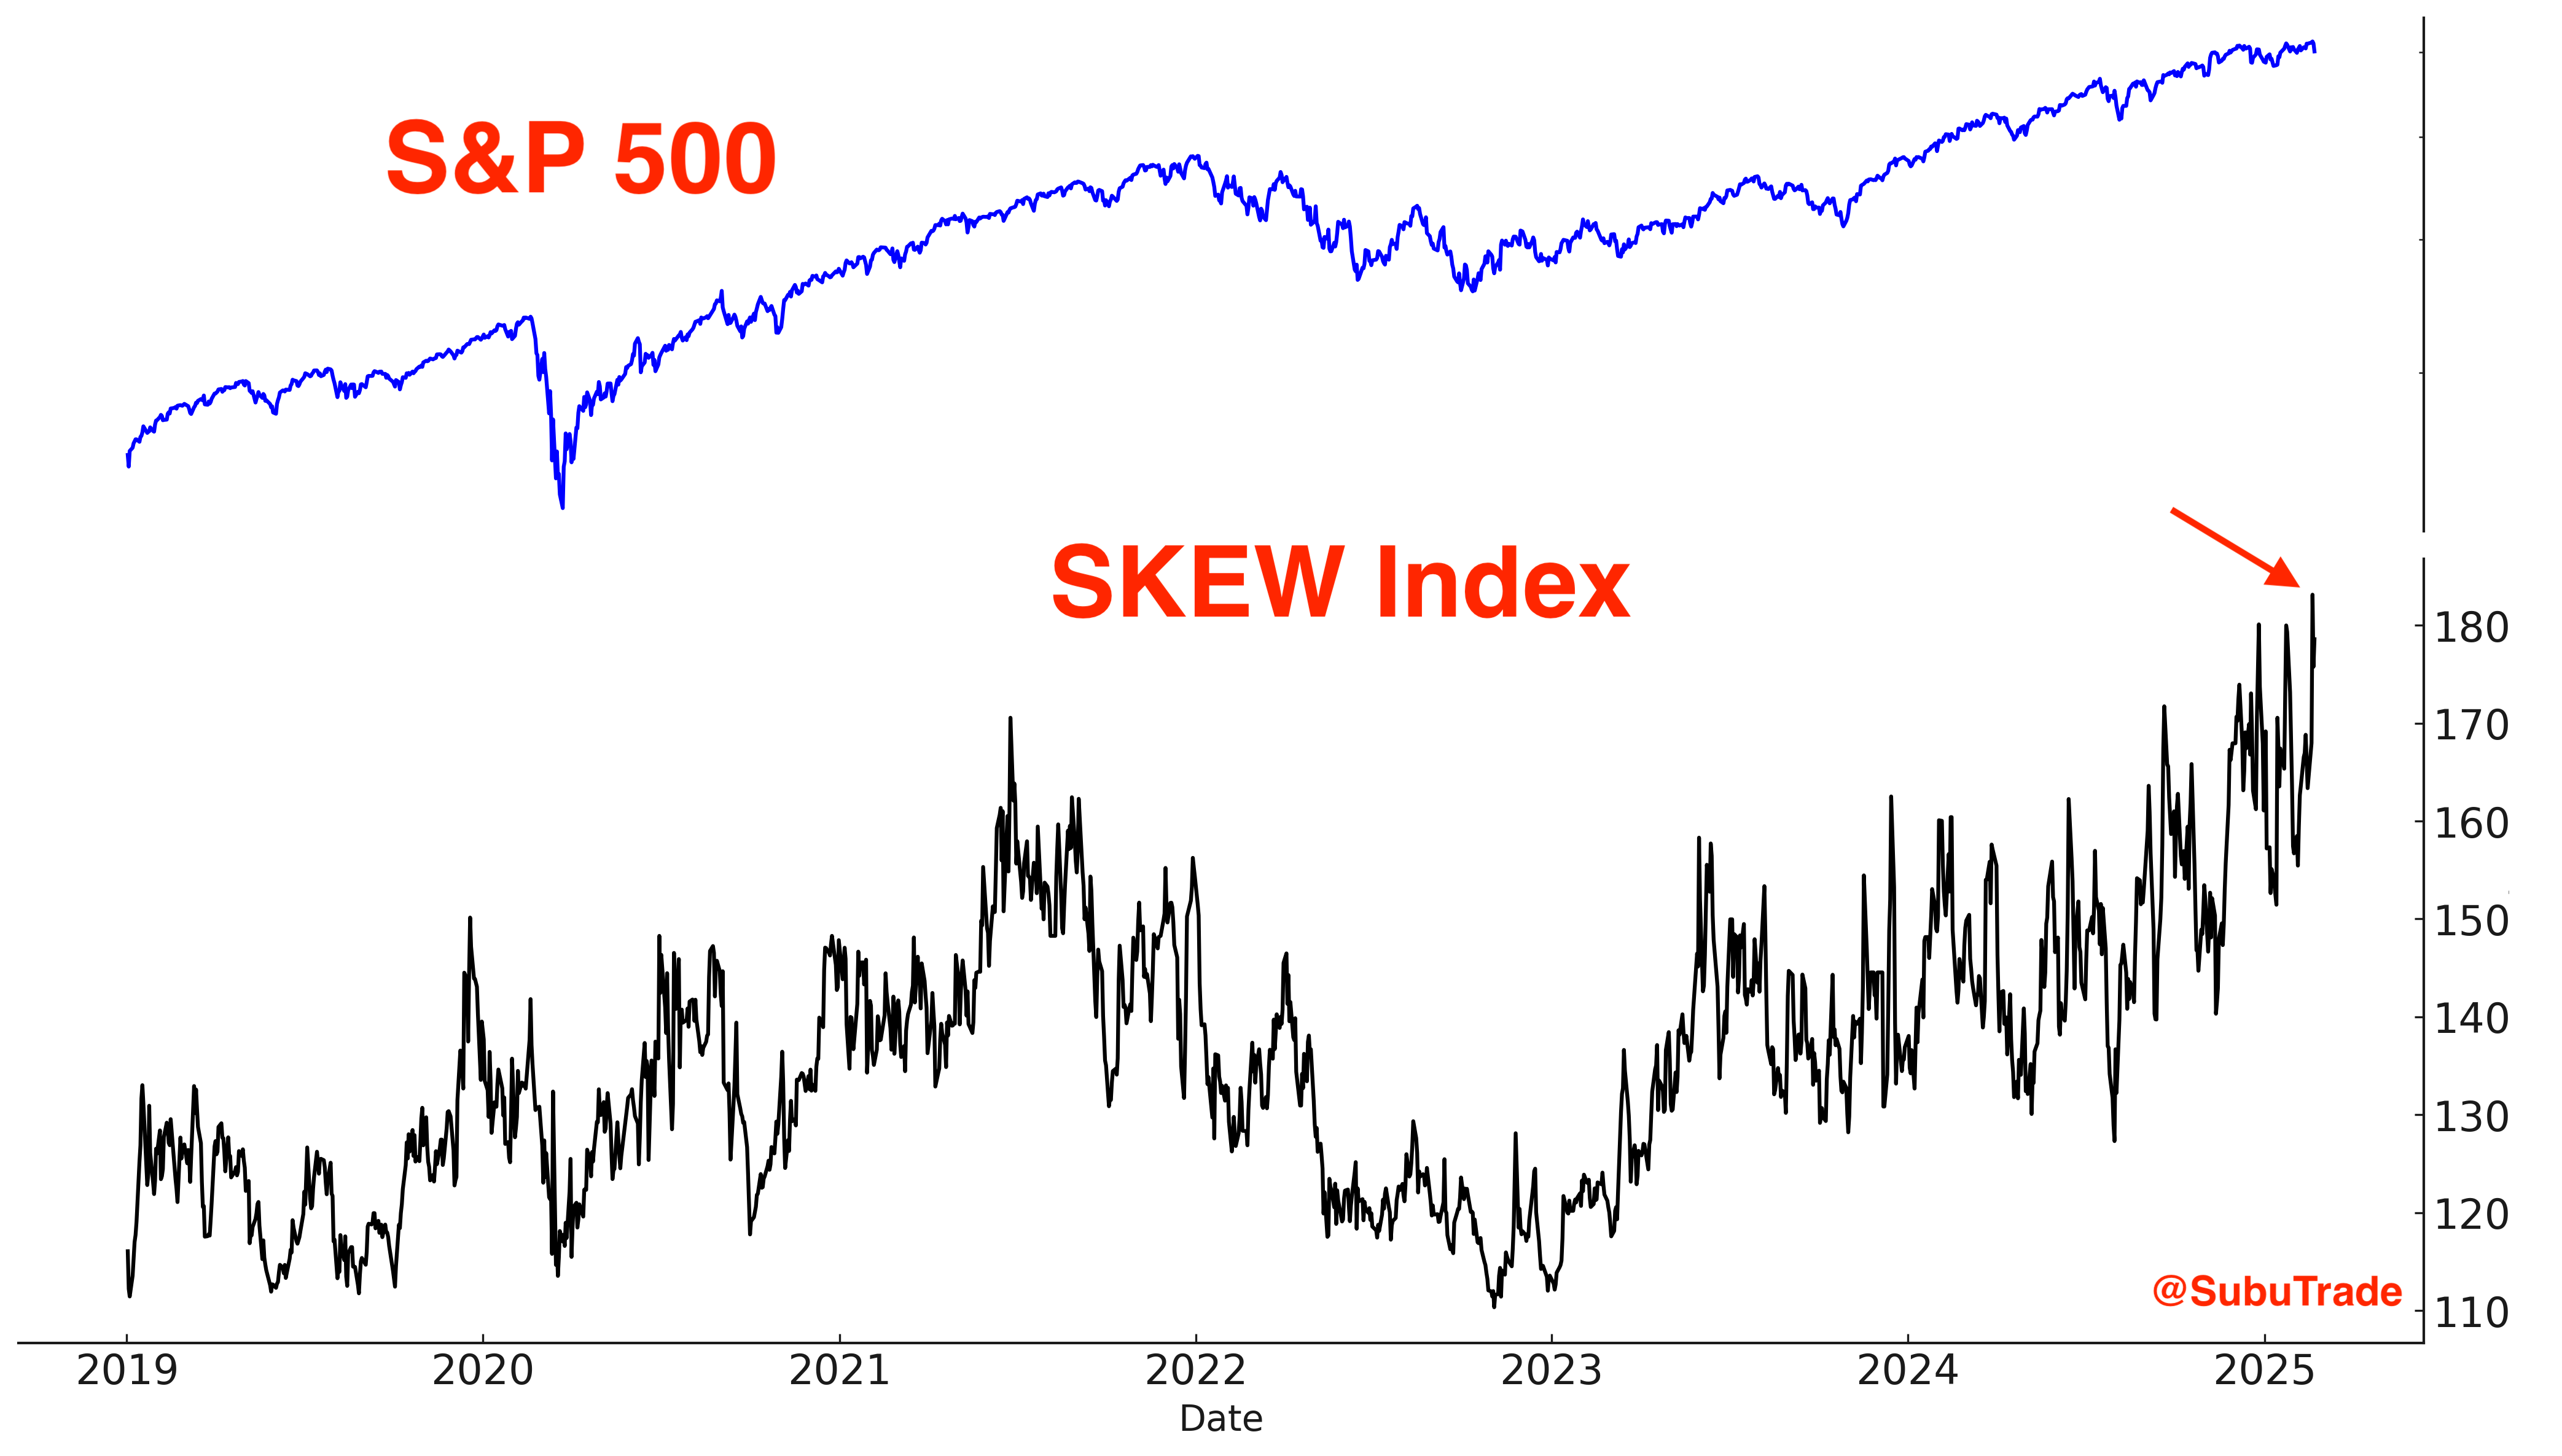
The SKEW Index, which essentially measures the probability of a stock market crash, jumped to an all-time high this week. This is a long term concern:
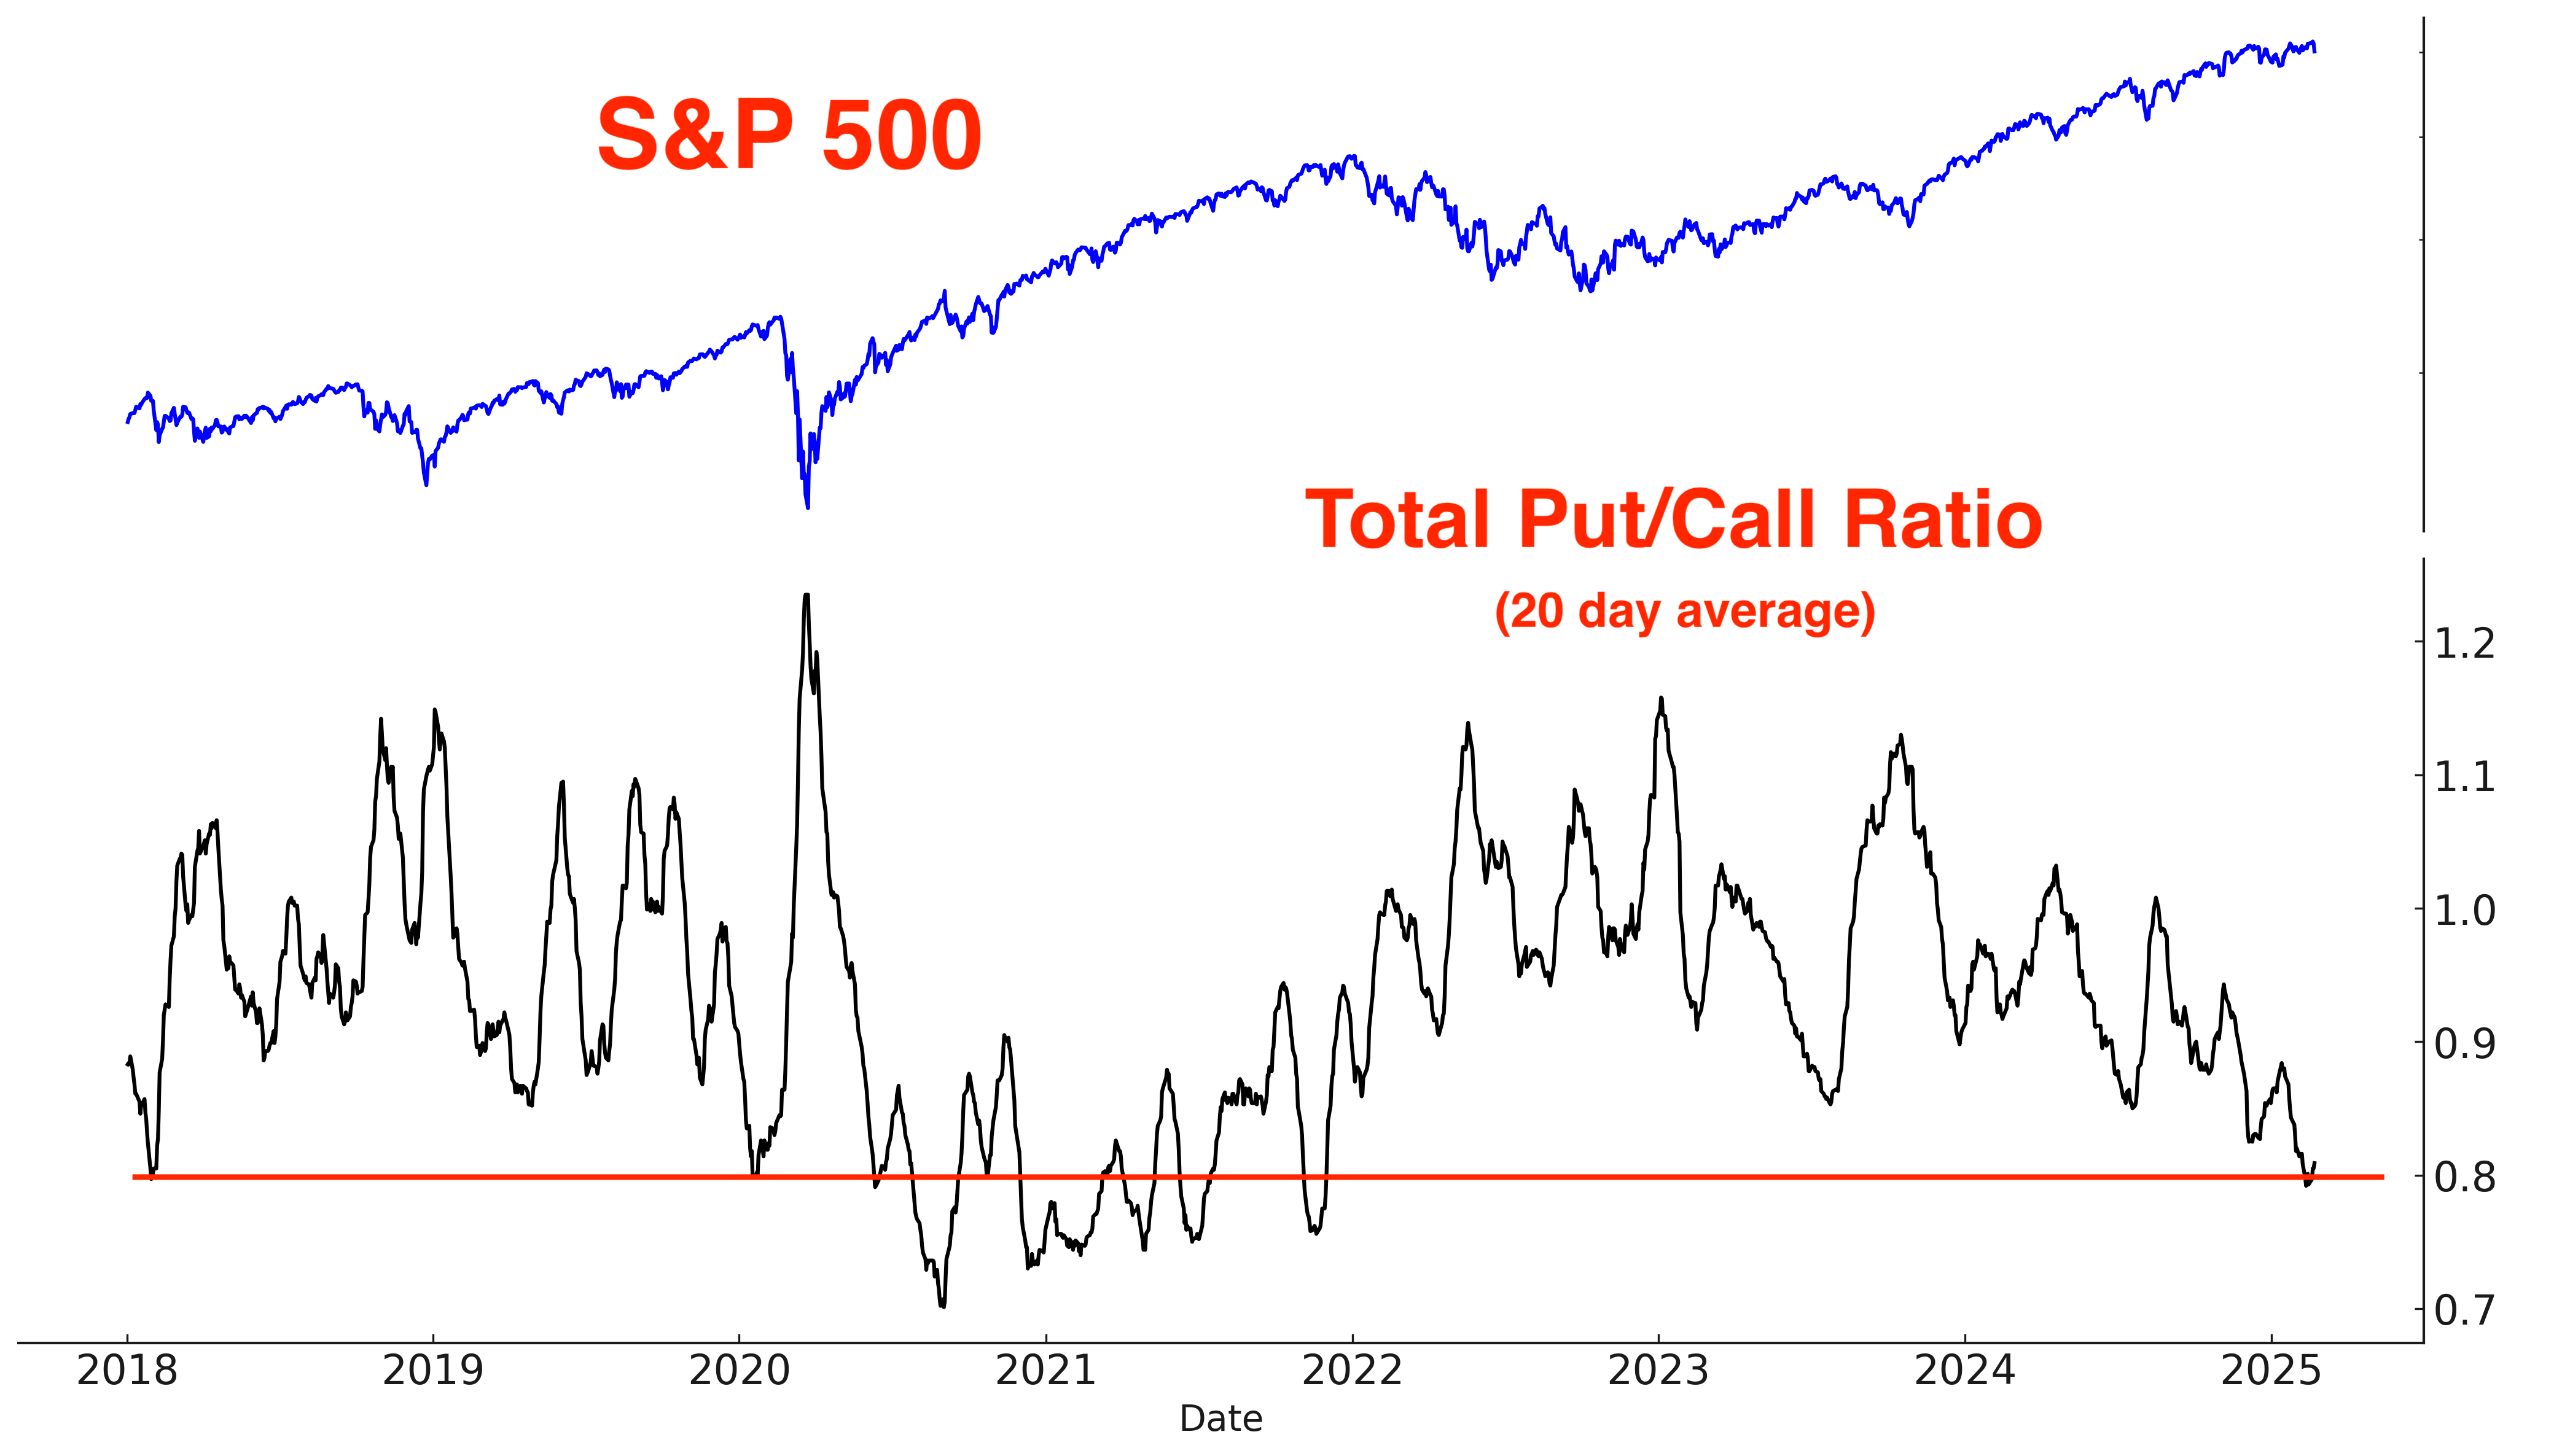
The CBOE’s Total Put/Call Ratio is still extremely low. This is a long term concern:
Sentiment
The S&P 500’s Daily Sentiment Index is not extremely elevated:
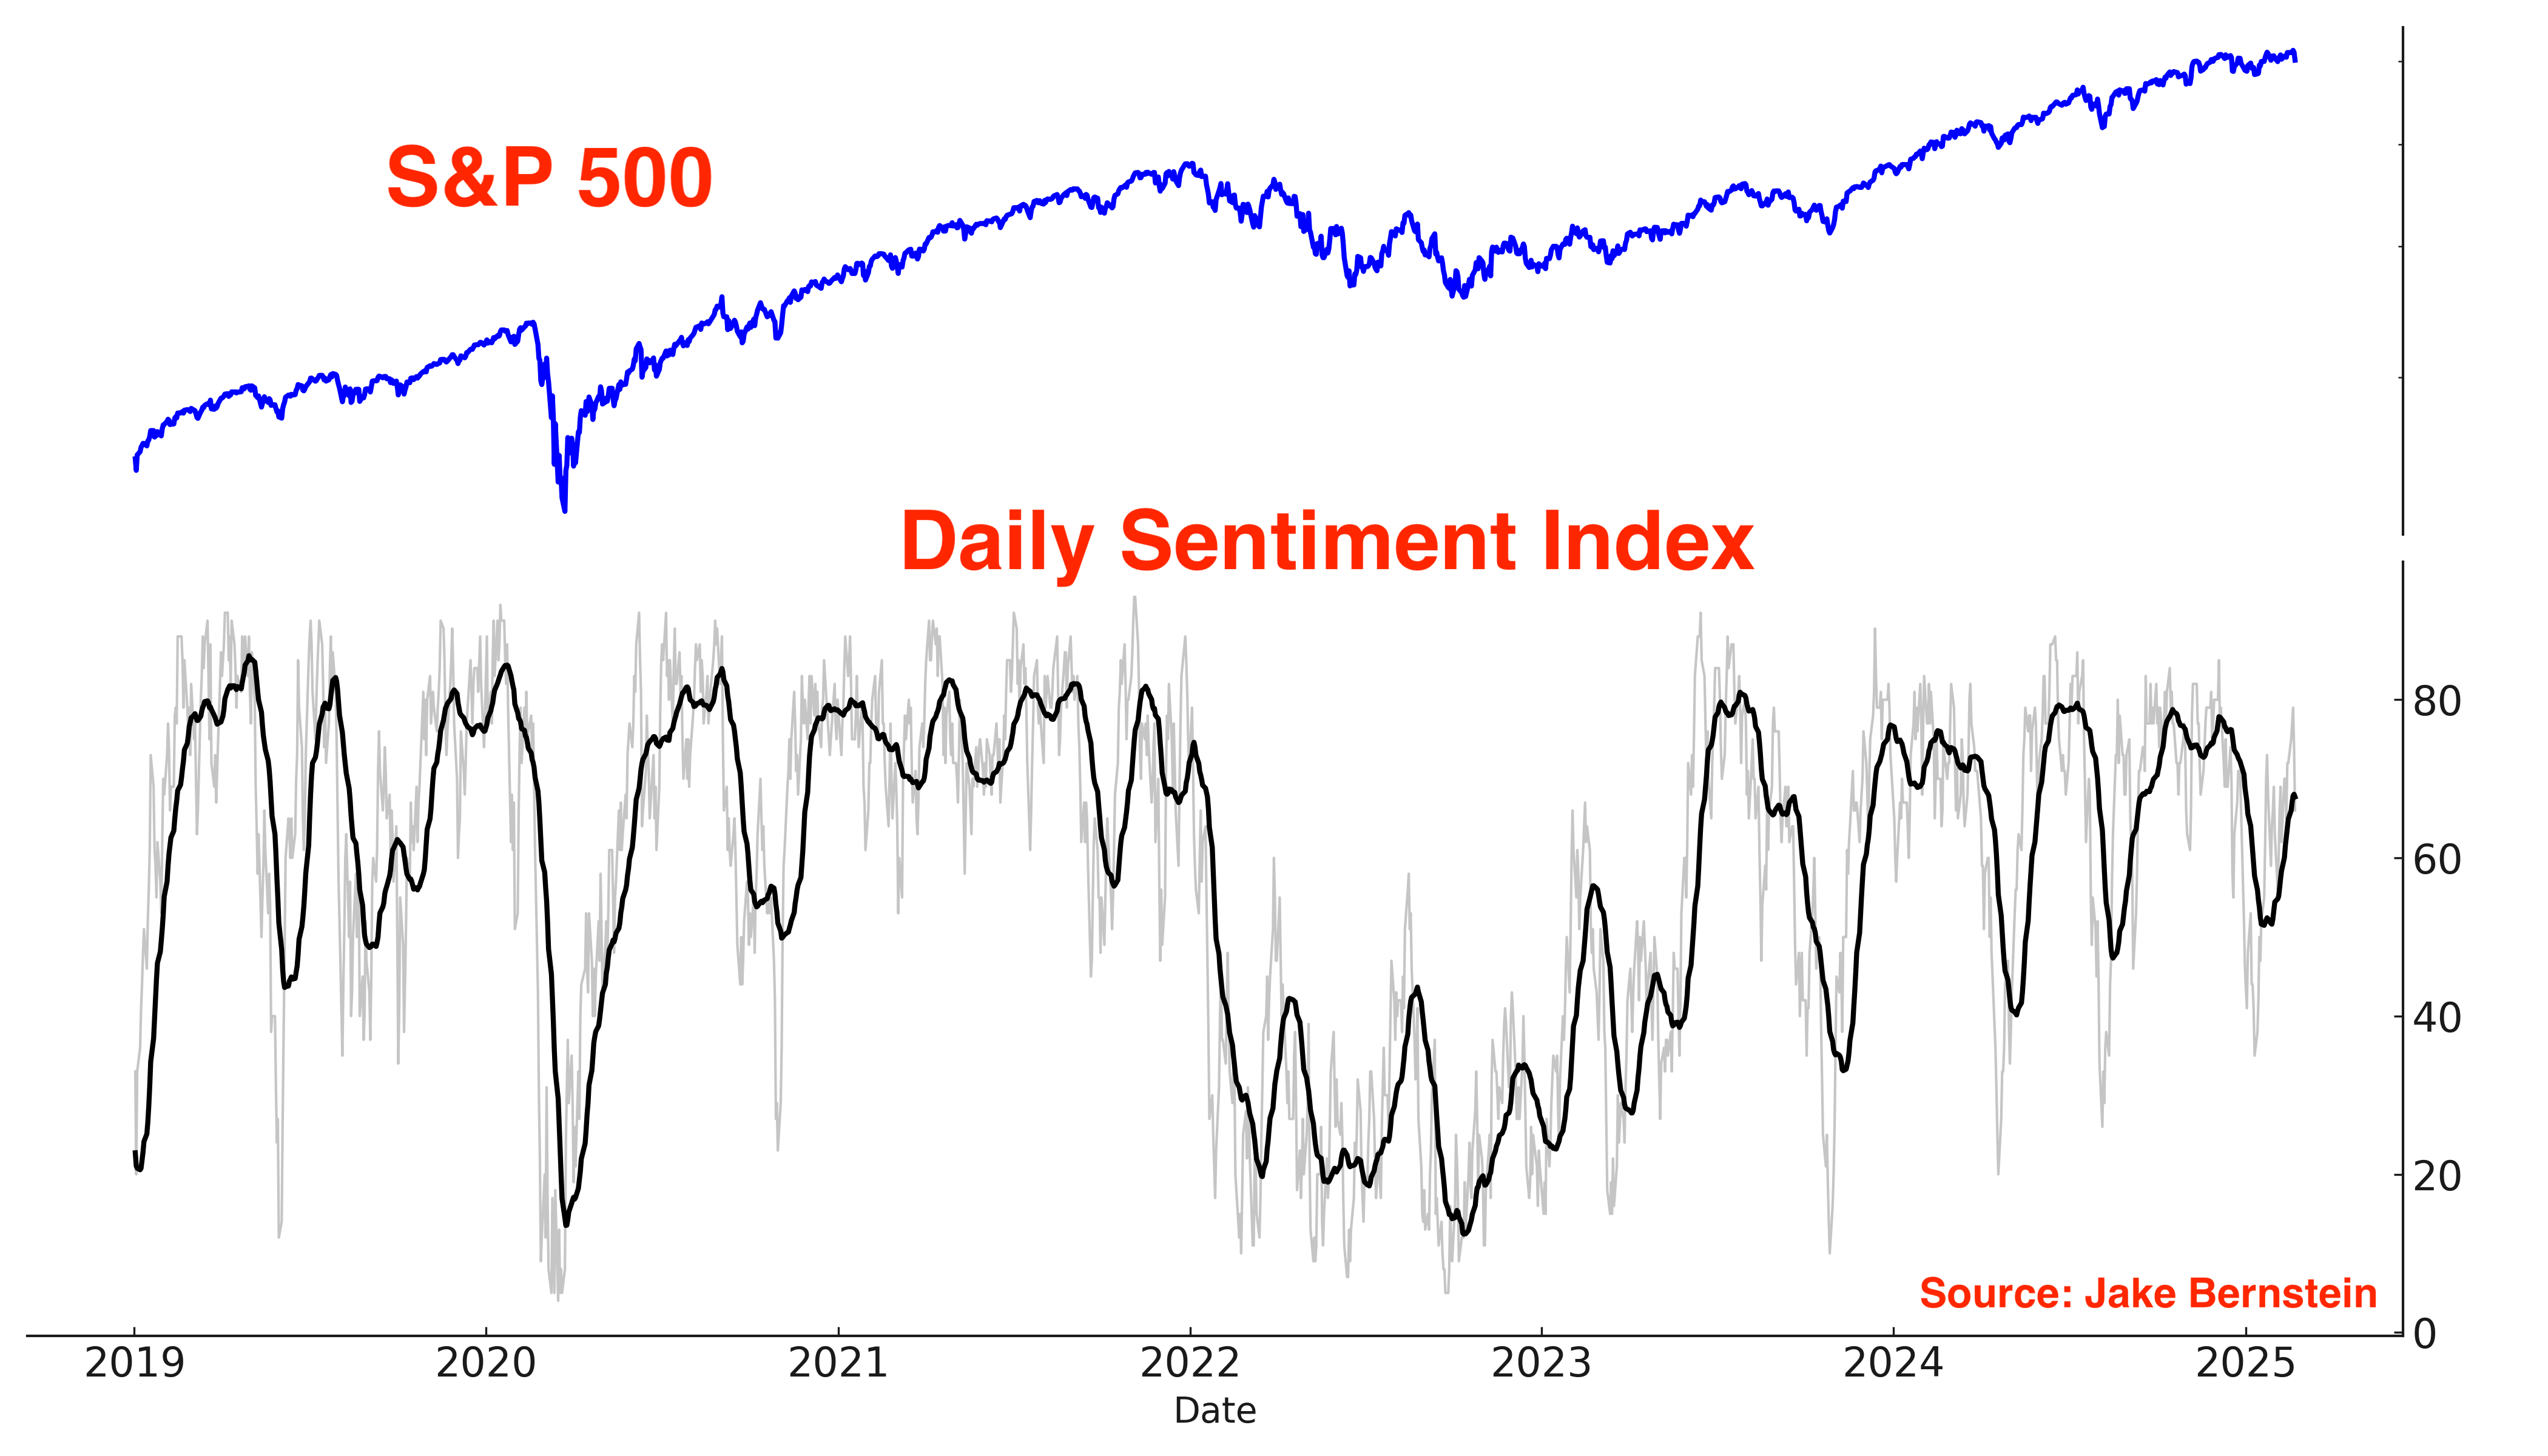
On the other hand, VIX’s Daily Sentiment Index jumped on Friday:
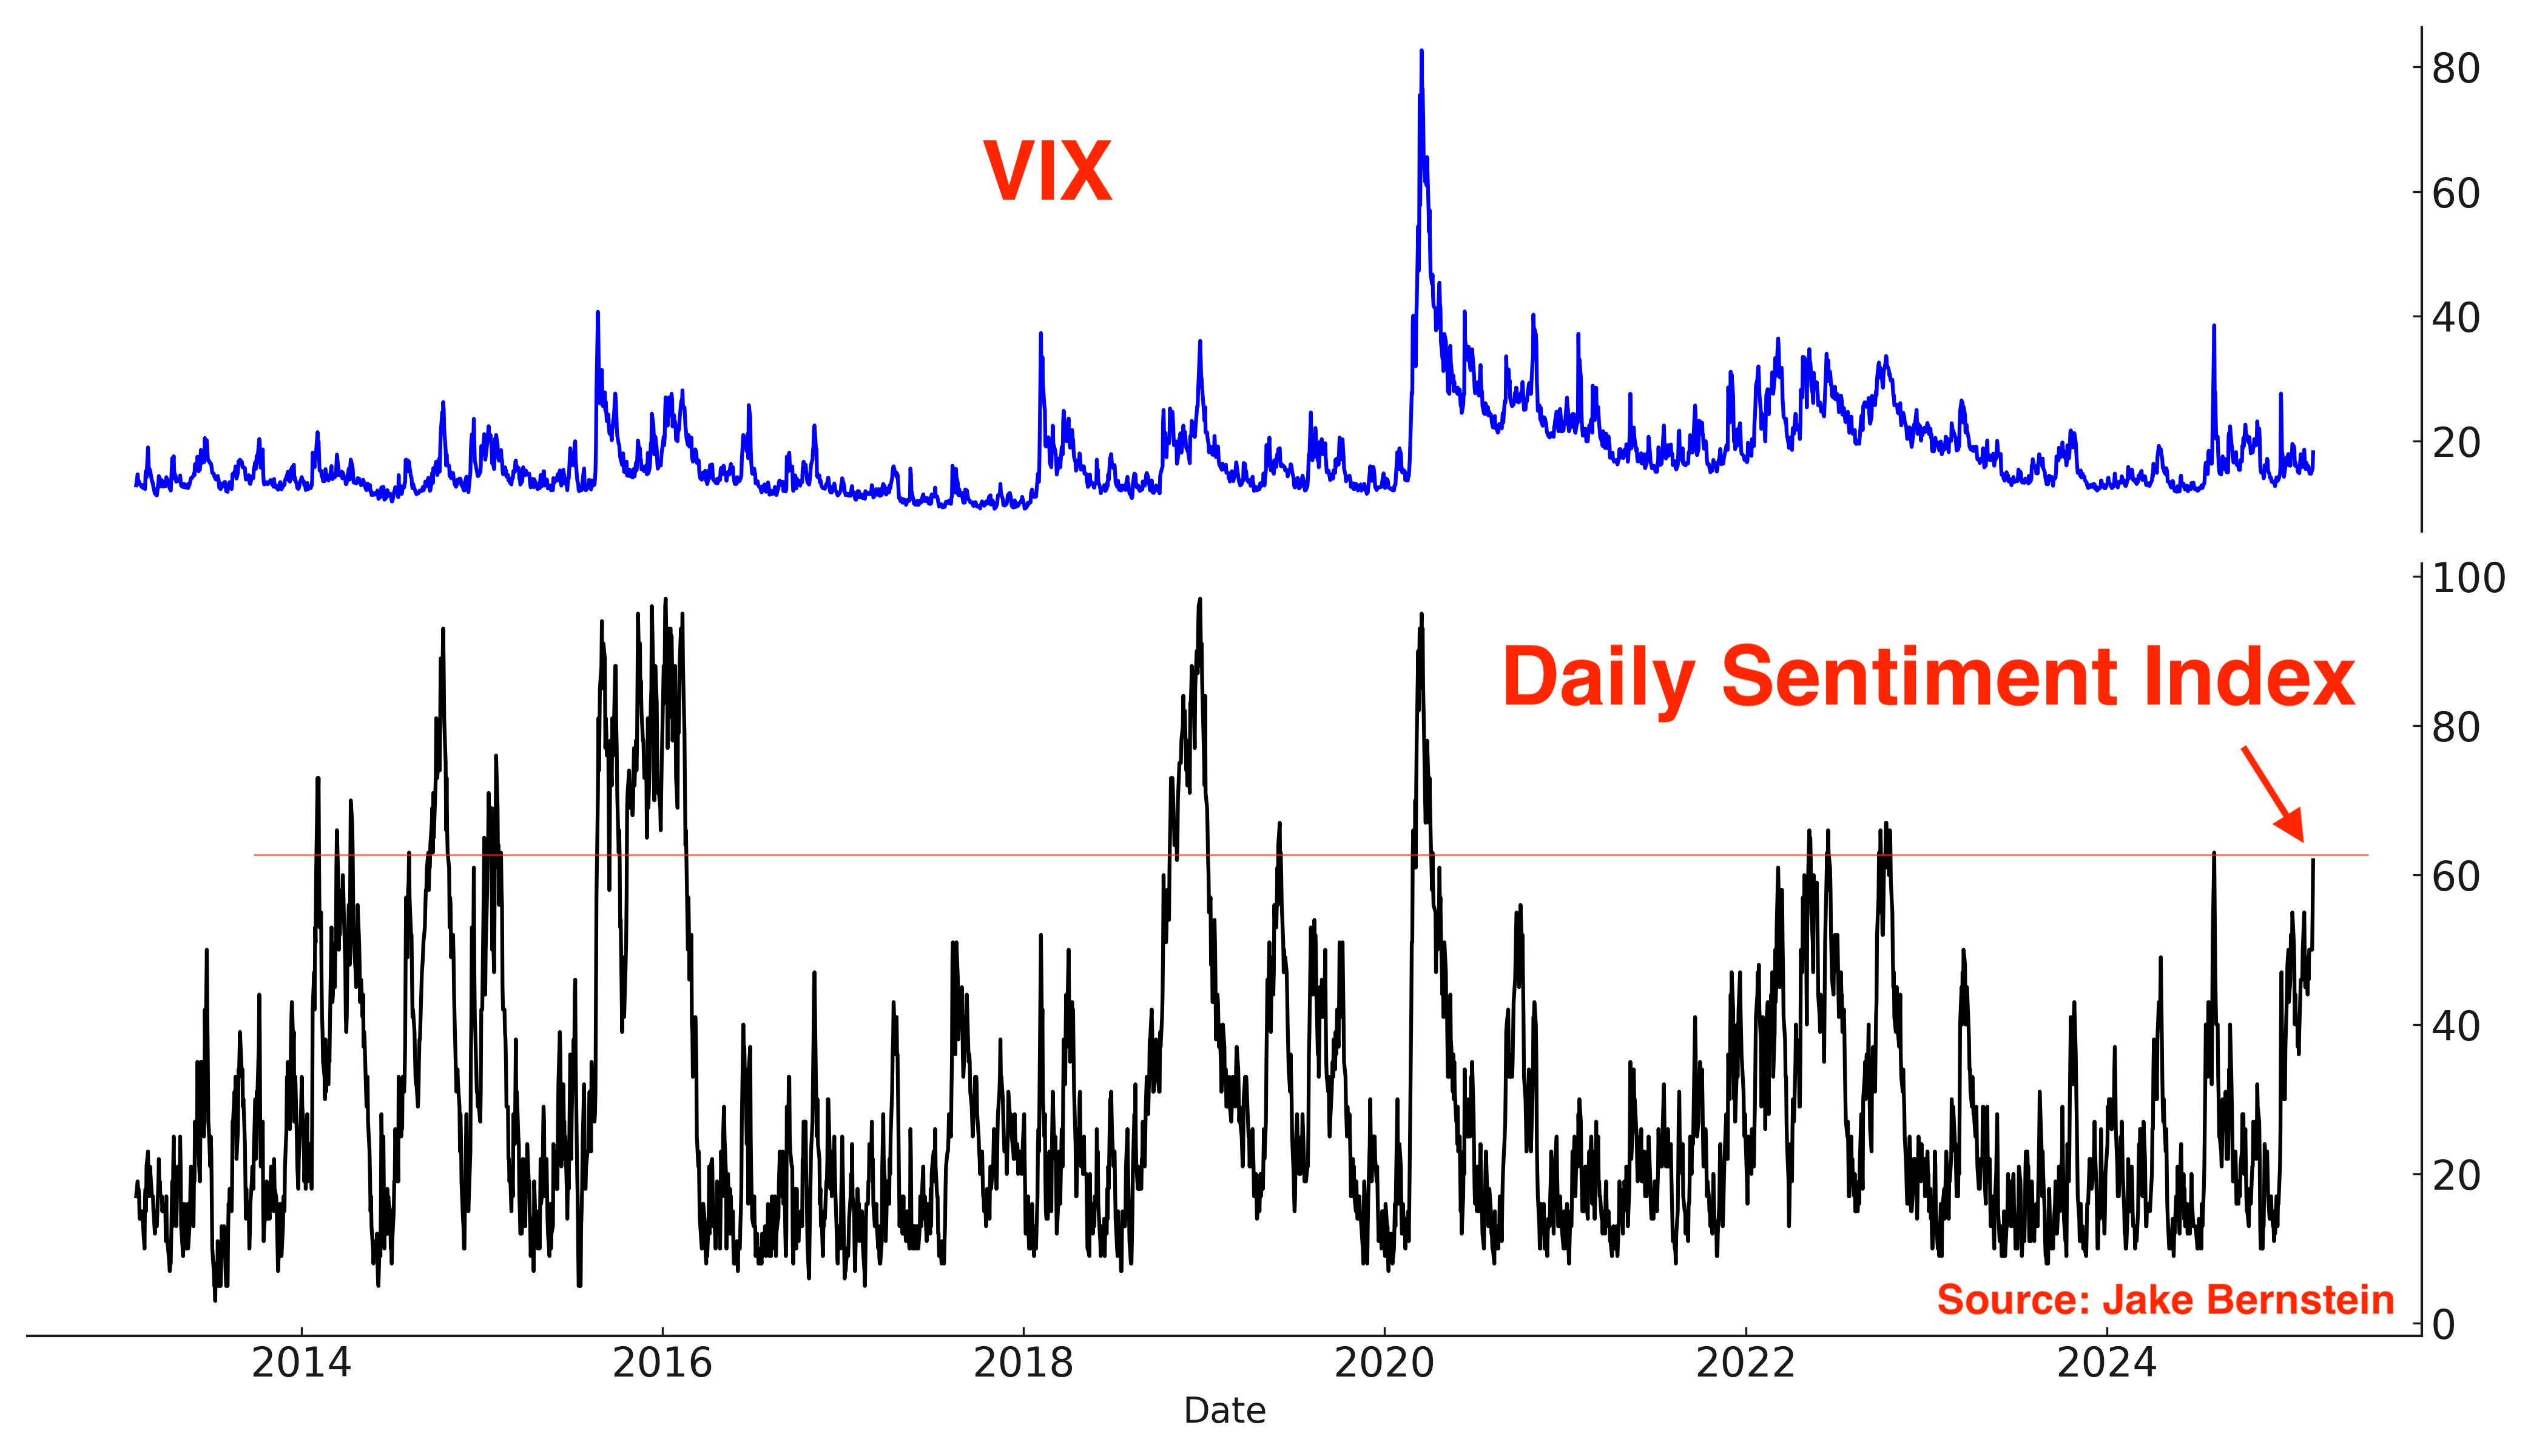
Historically this was a bullish sign for the S&P 500 over the next few weeks/months…

… while VIX fell.
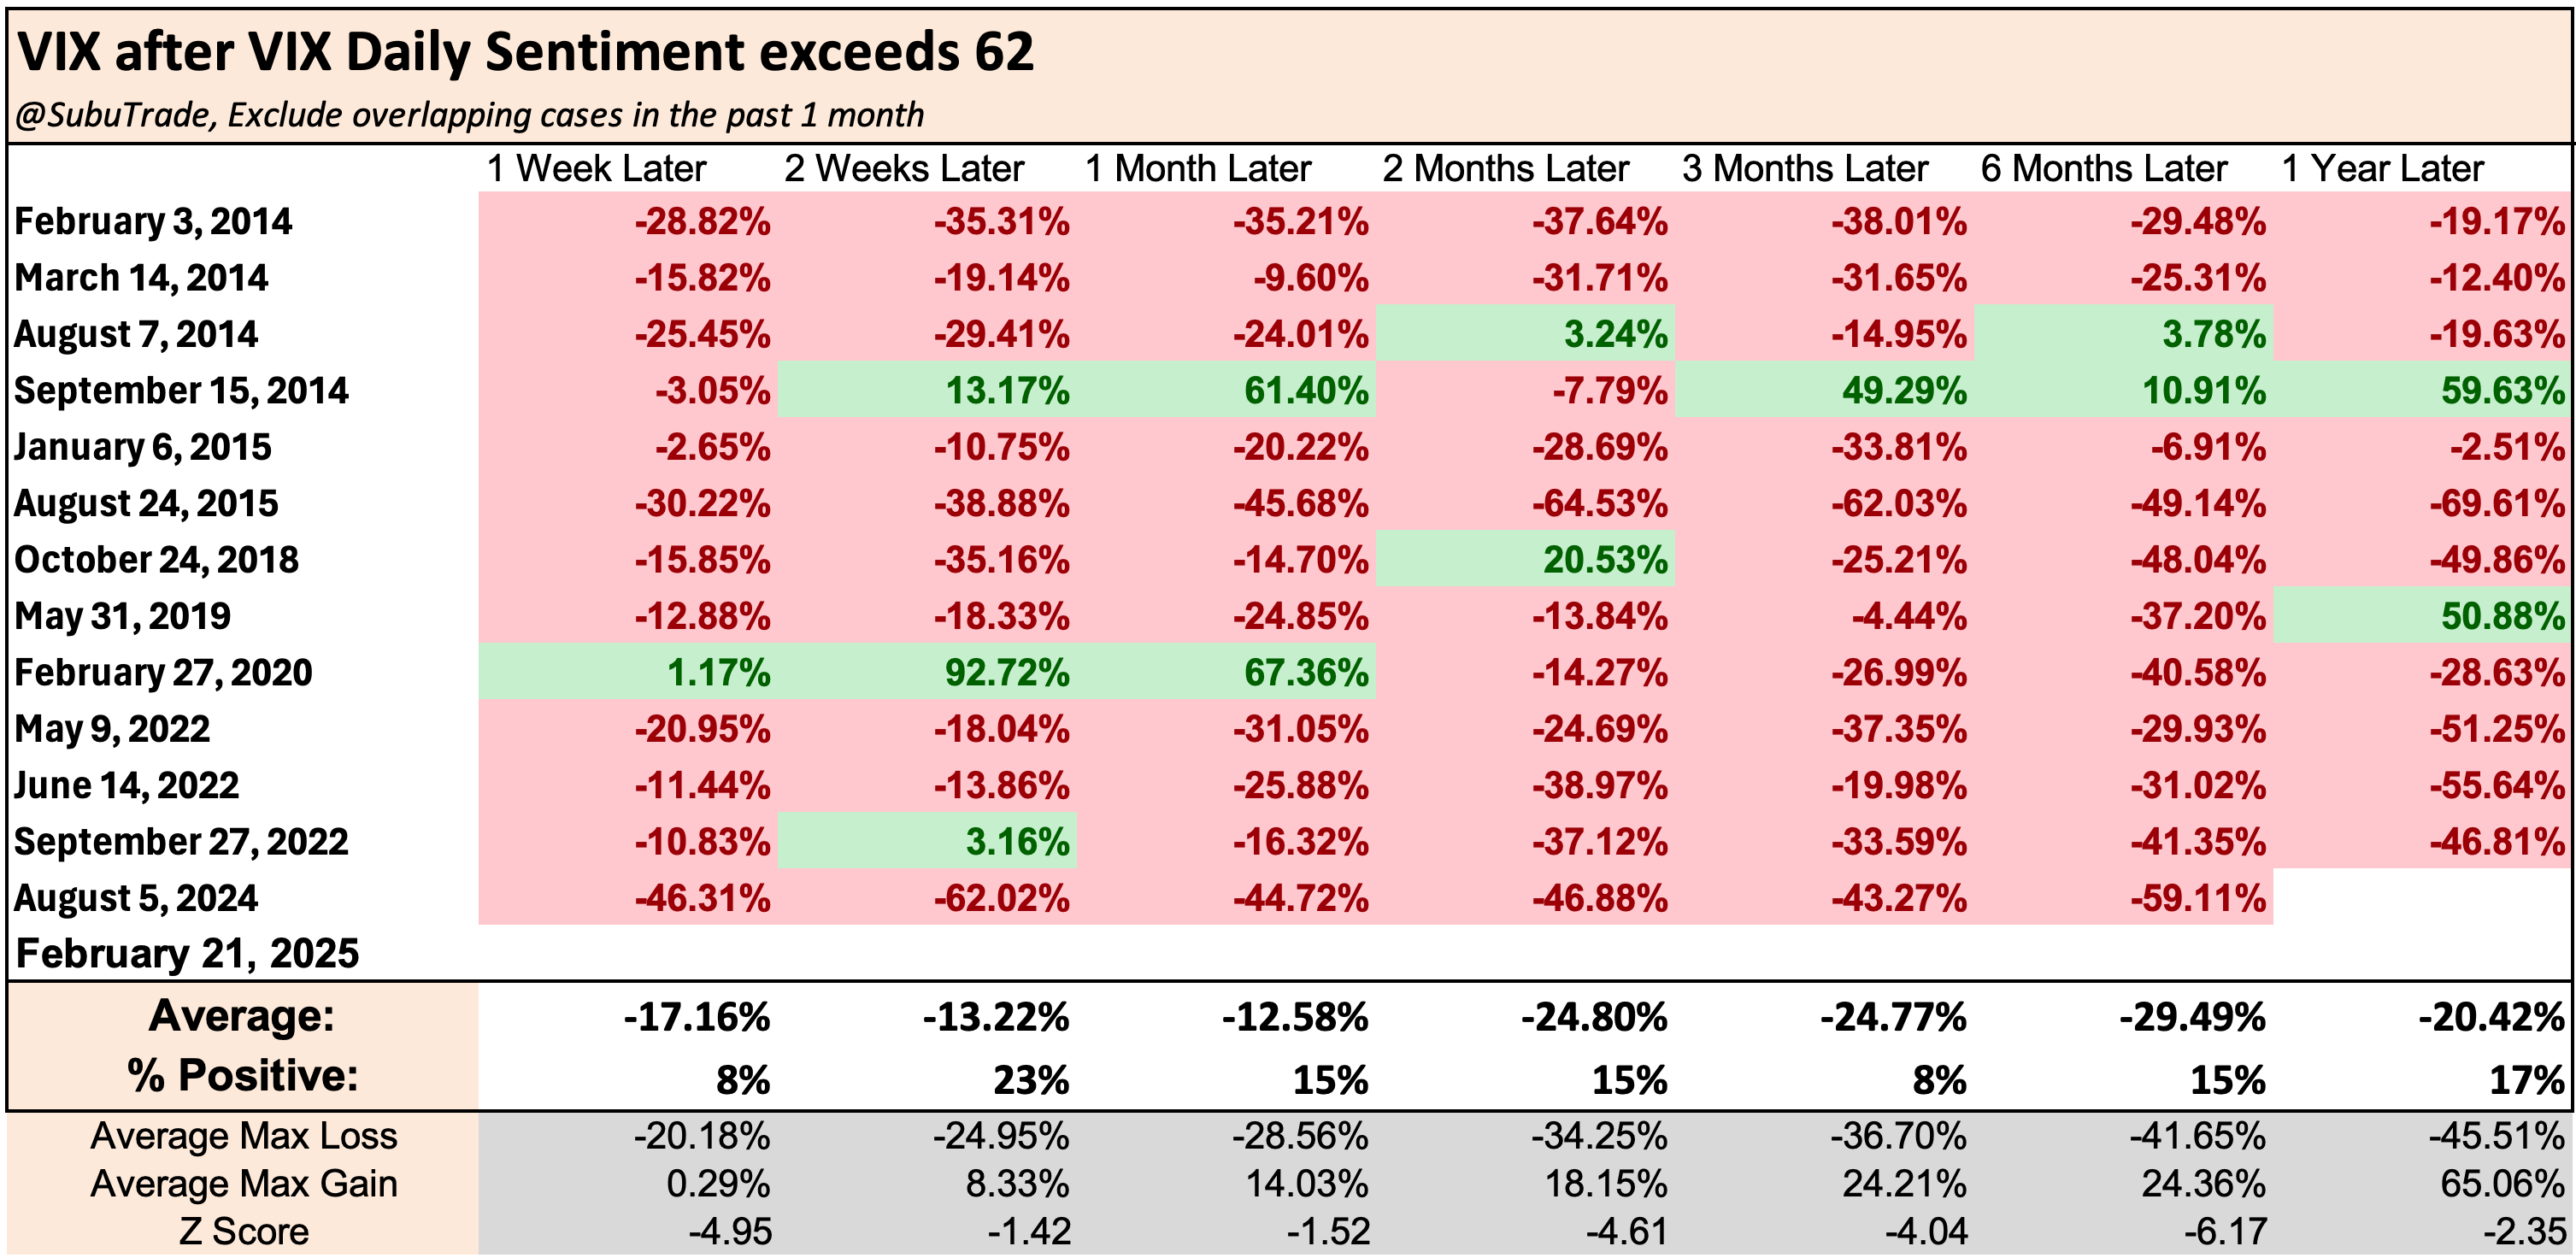
It is important to note that the VIX Daily Sentiment Index is based on approximately a decade of data. Its effectiveness in a prolonged and severe bear market, such as the one experienced in 2008, is yet to be seen.
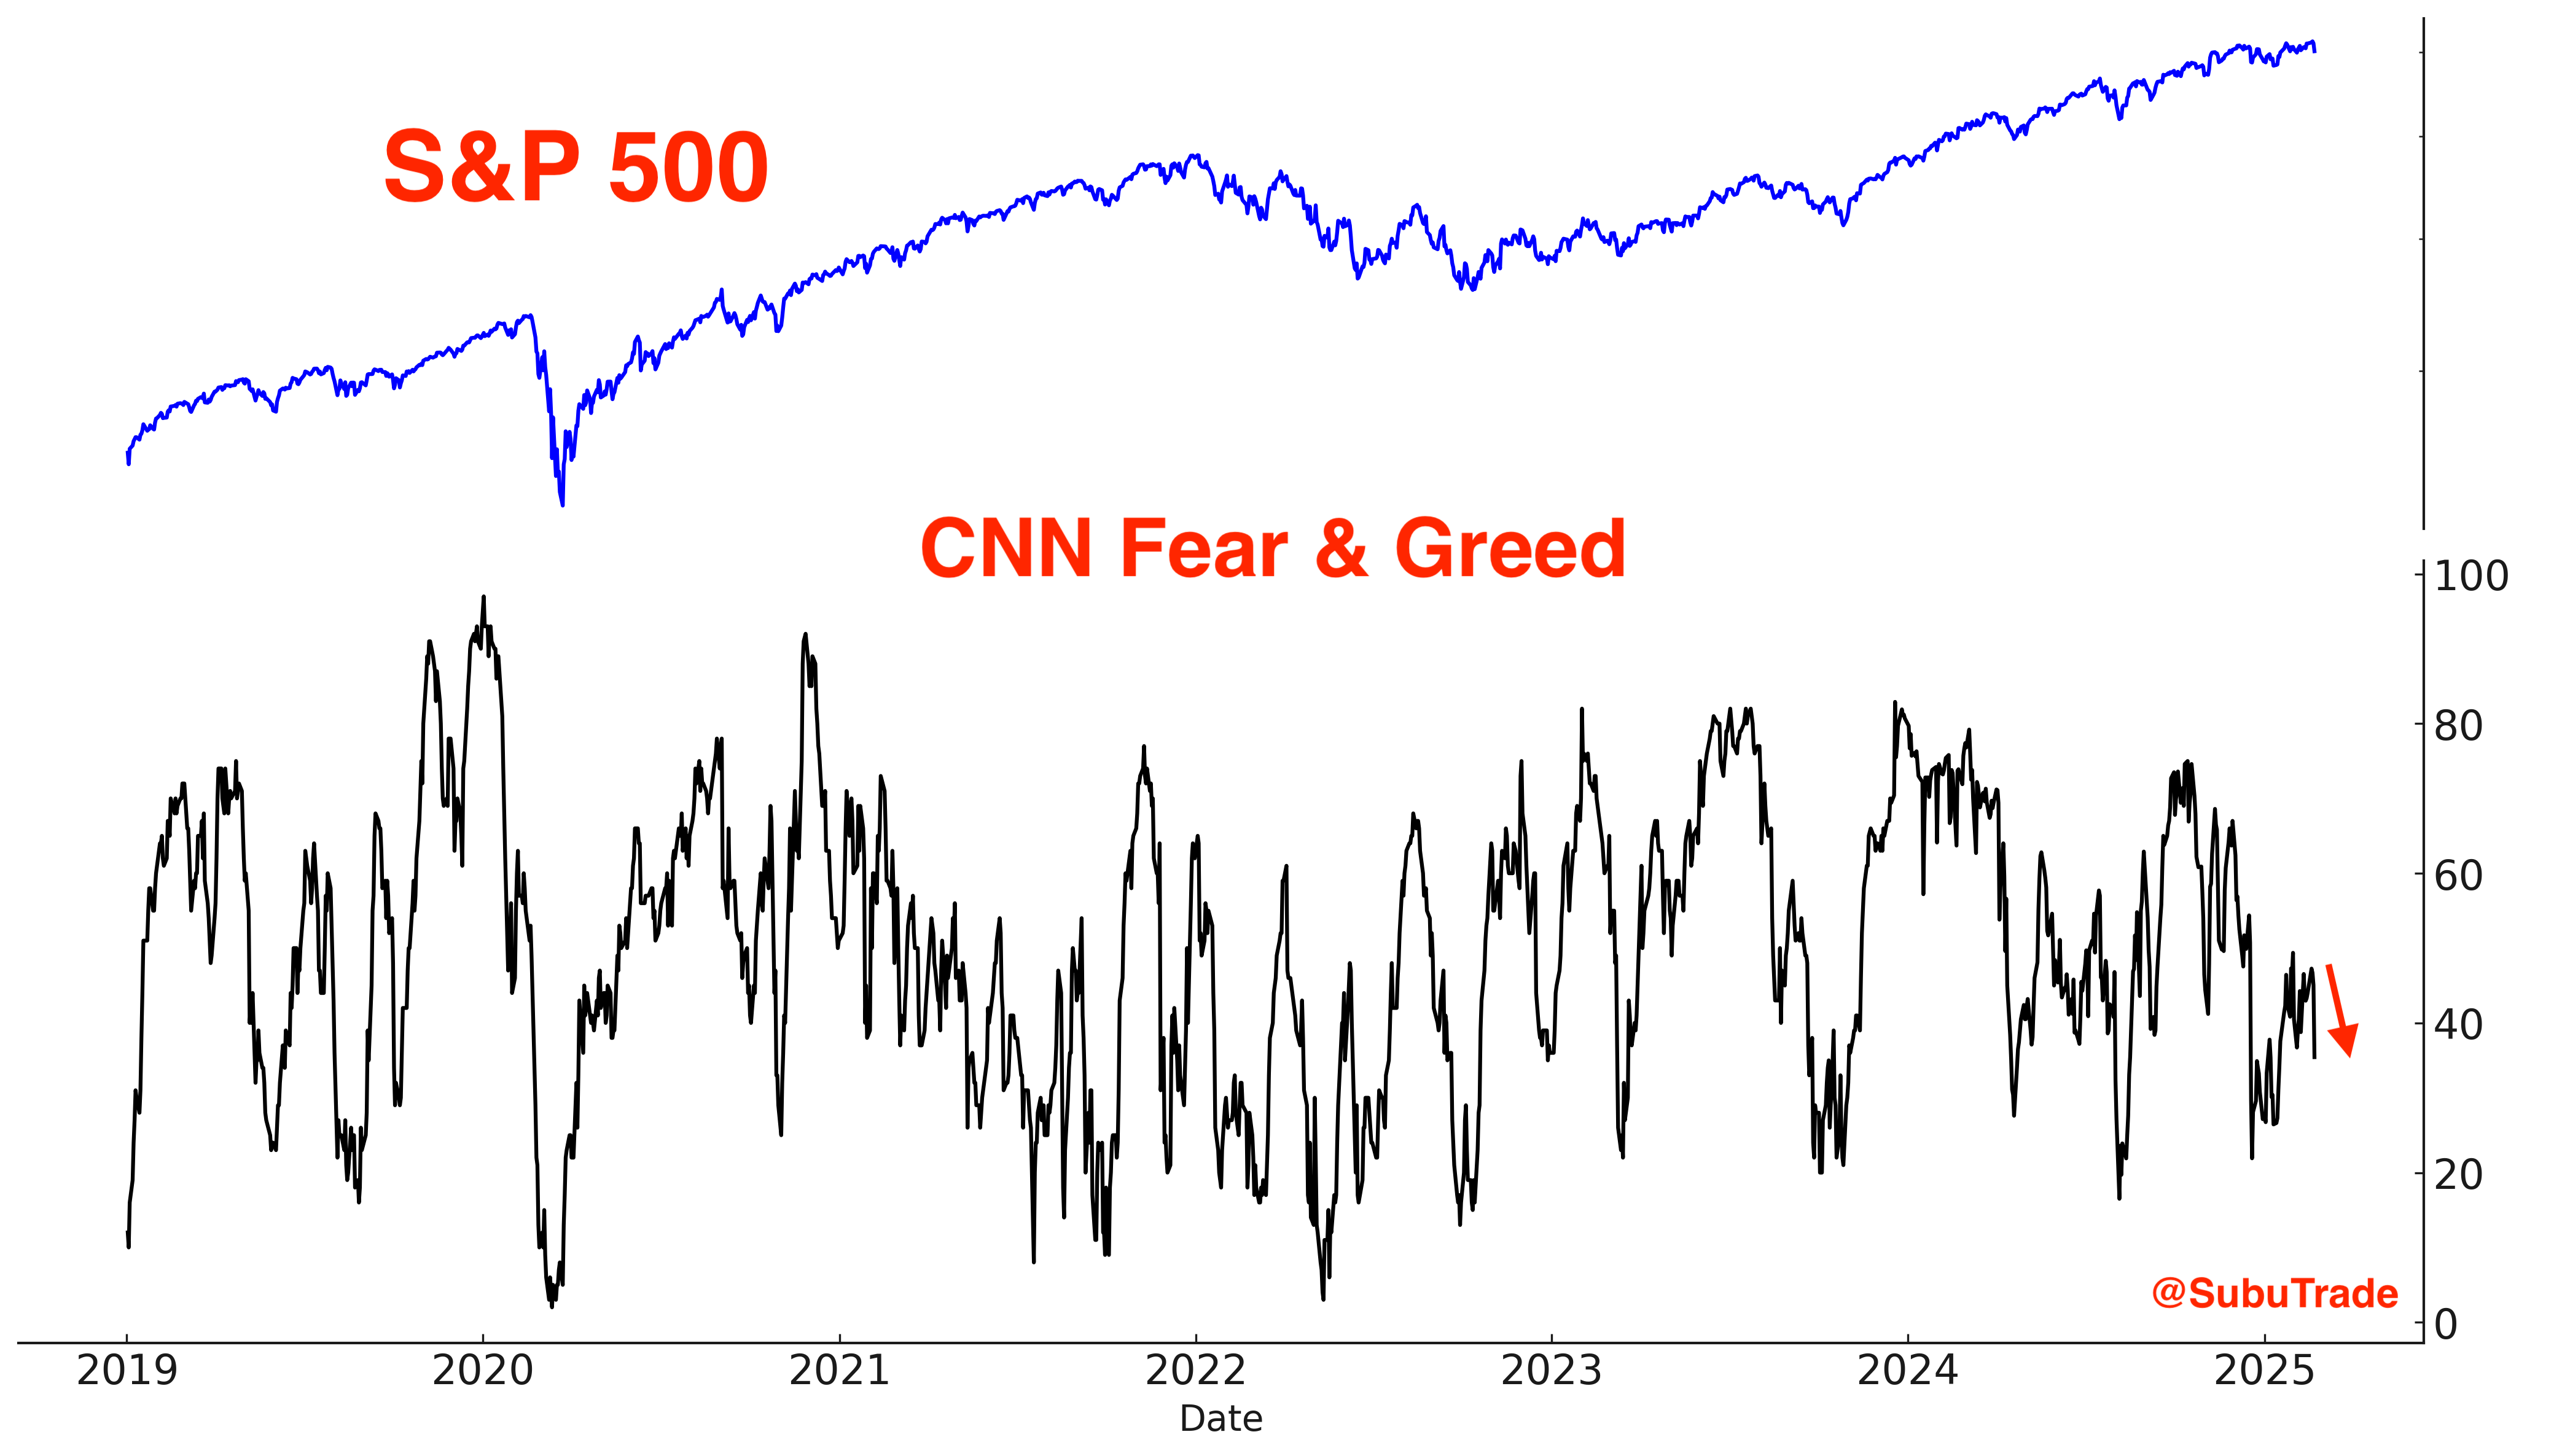
The CNN Fear & Greed Index fell a little on Friday, but overall is in neutral territory:
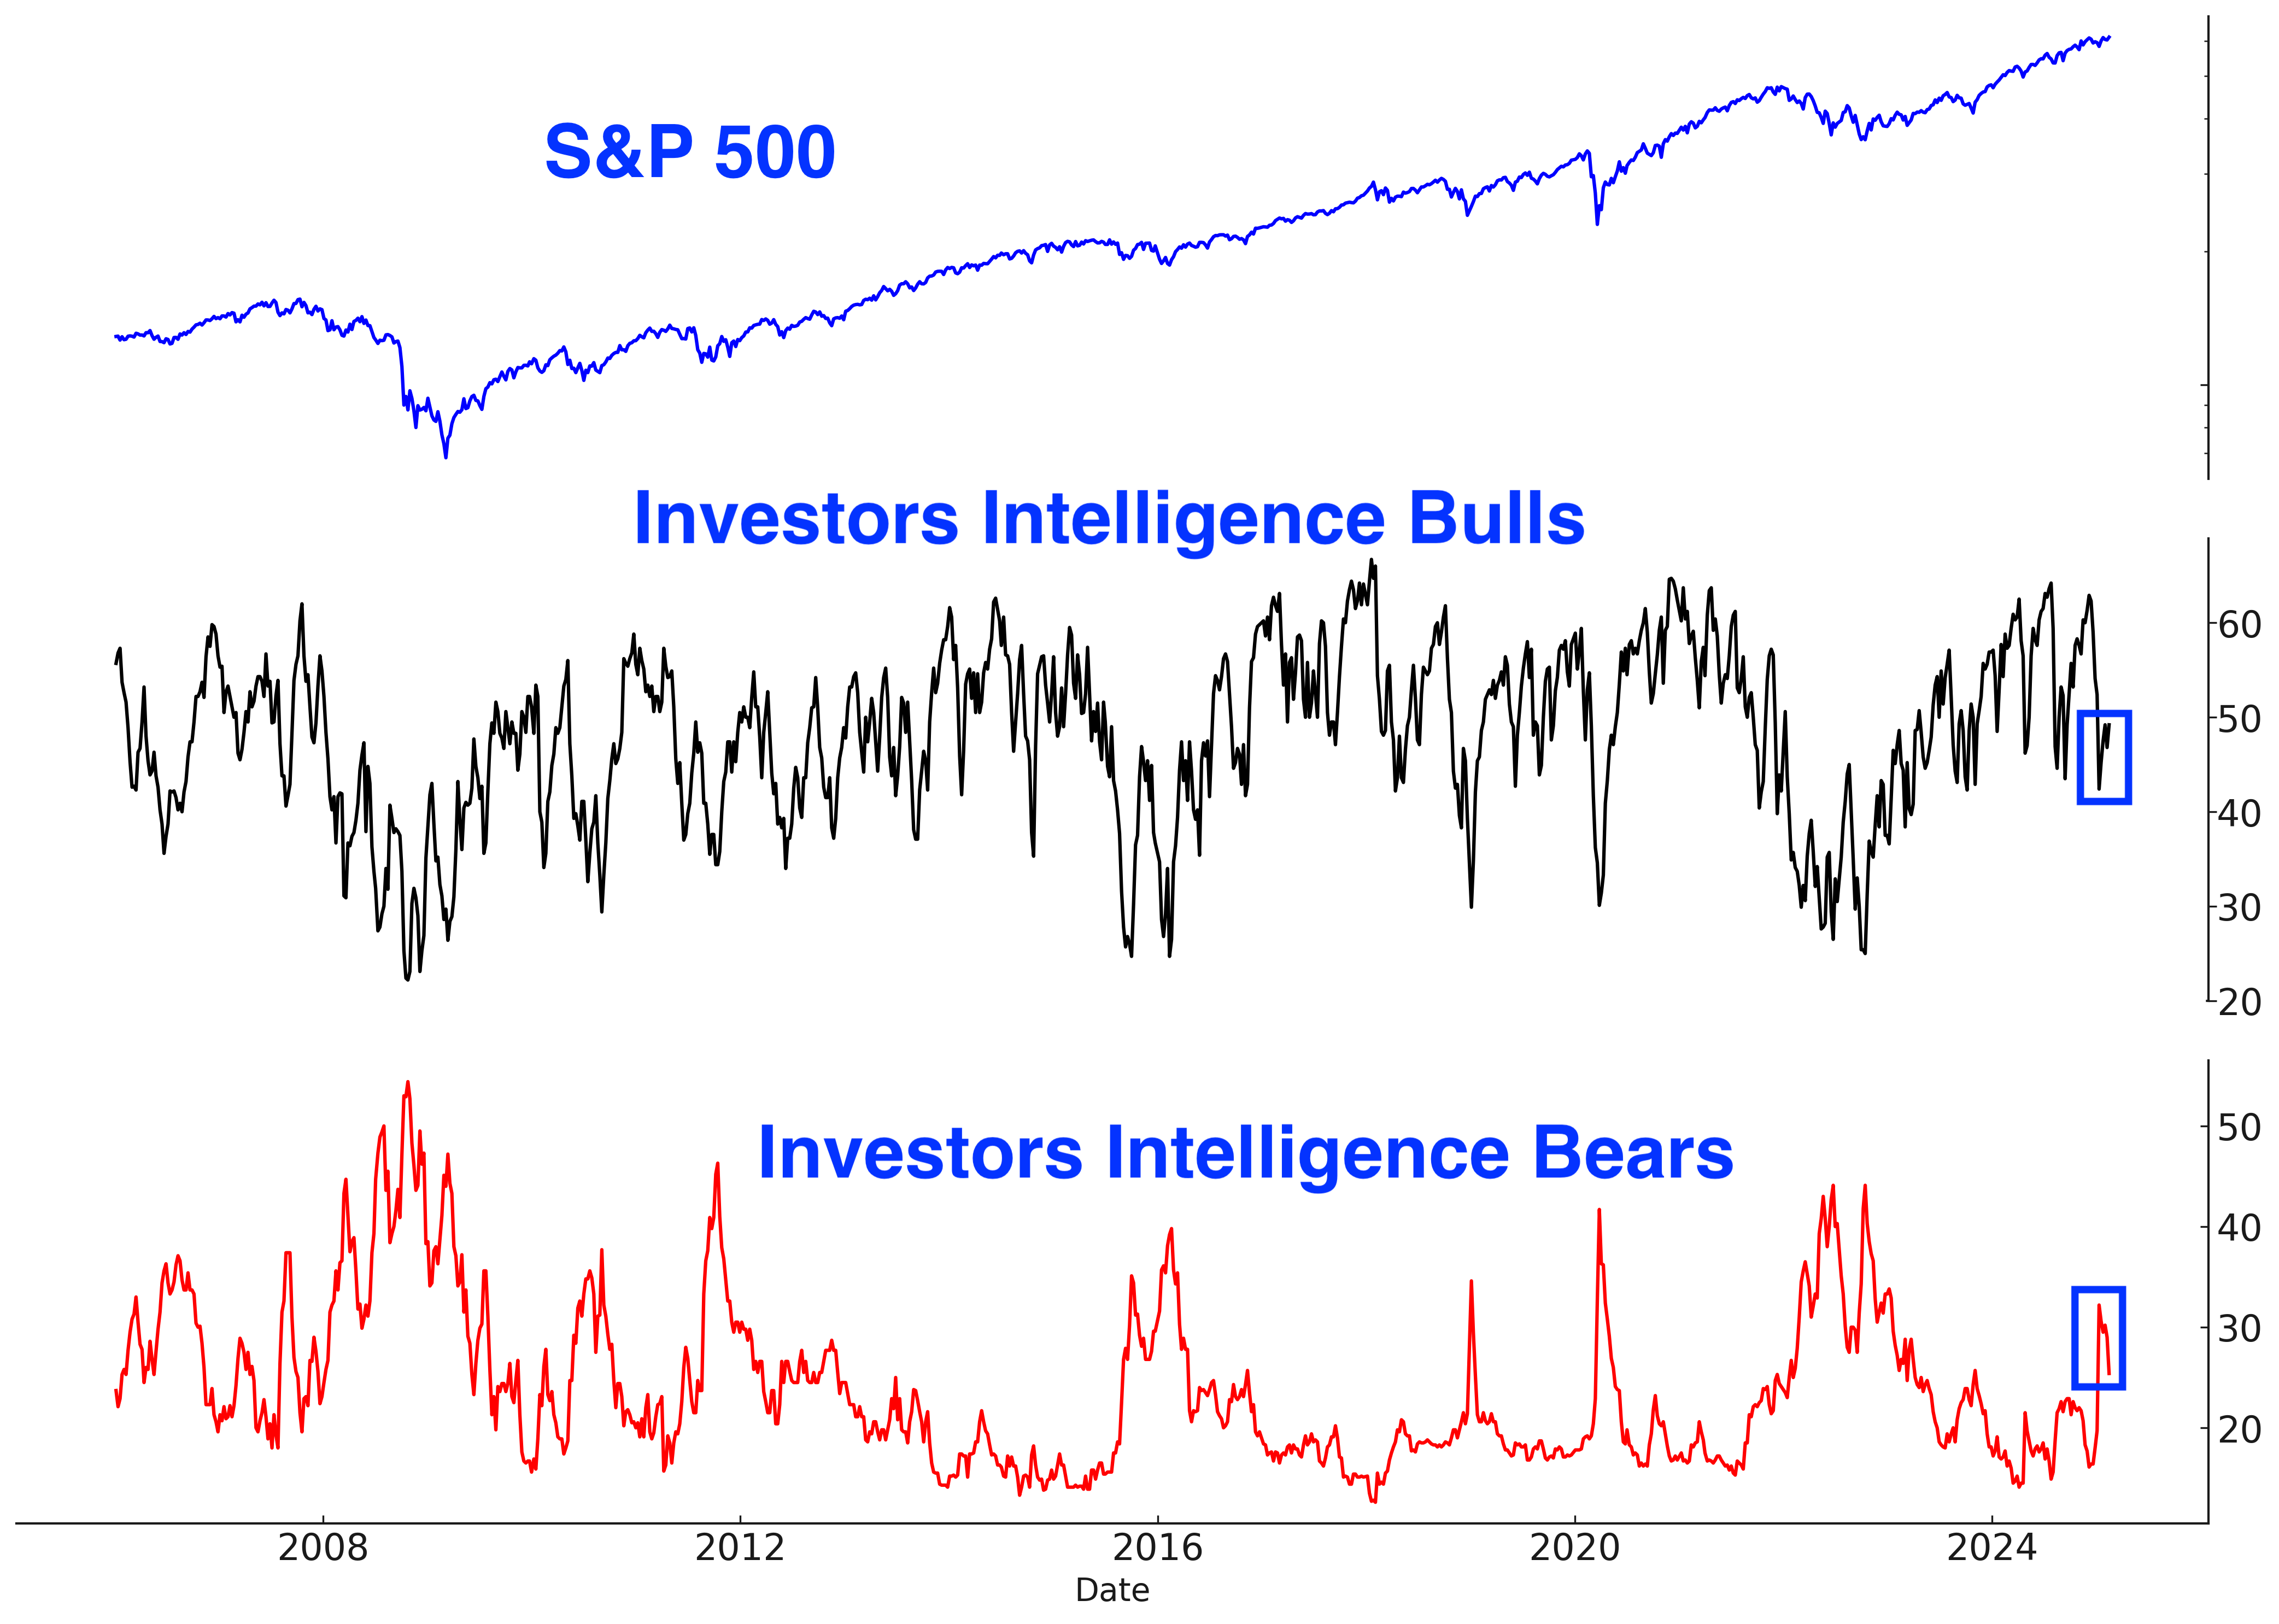
Sentiment Surveys:
Sentiment surveys continue to show elevated levels of pessimism, which is uncommon when the U.S. stock market is so close to an all-time high:
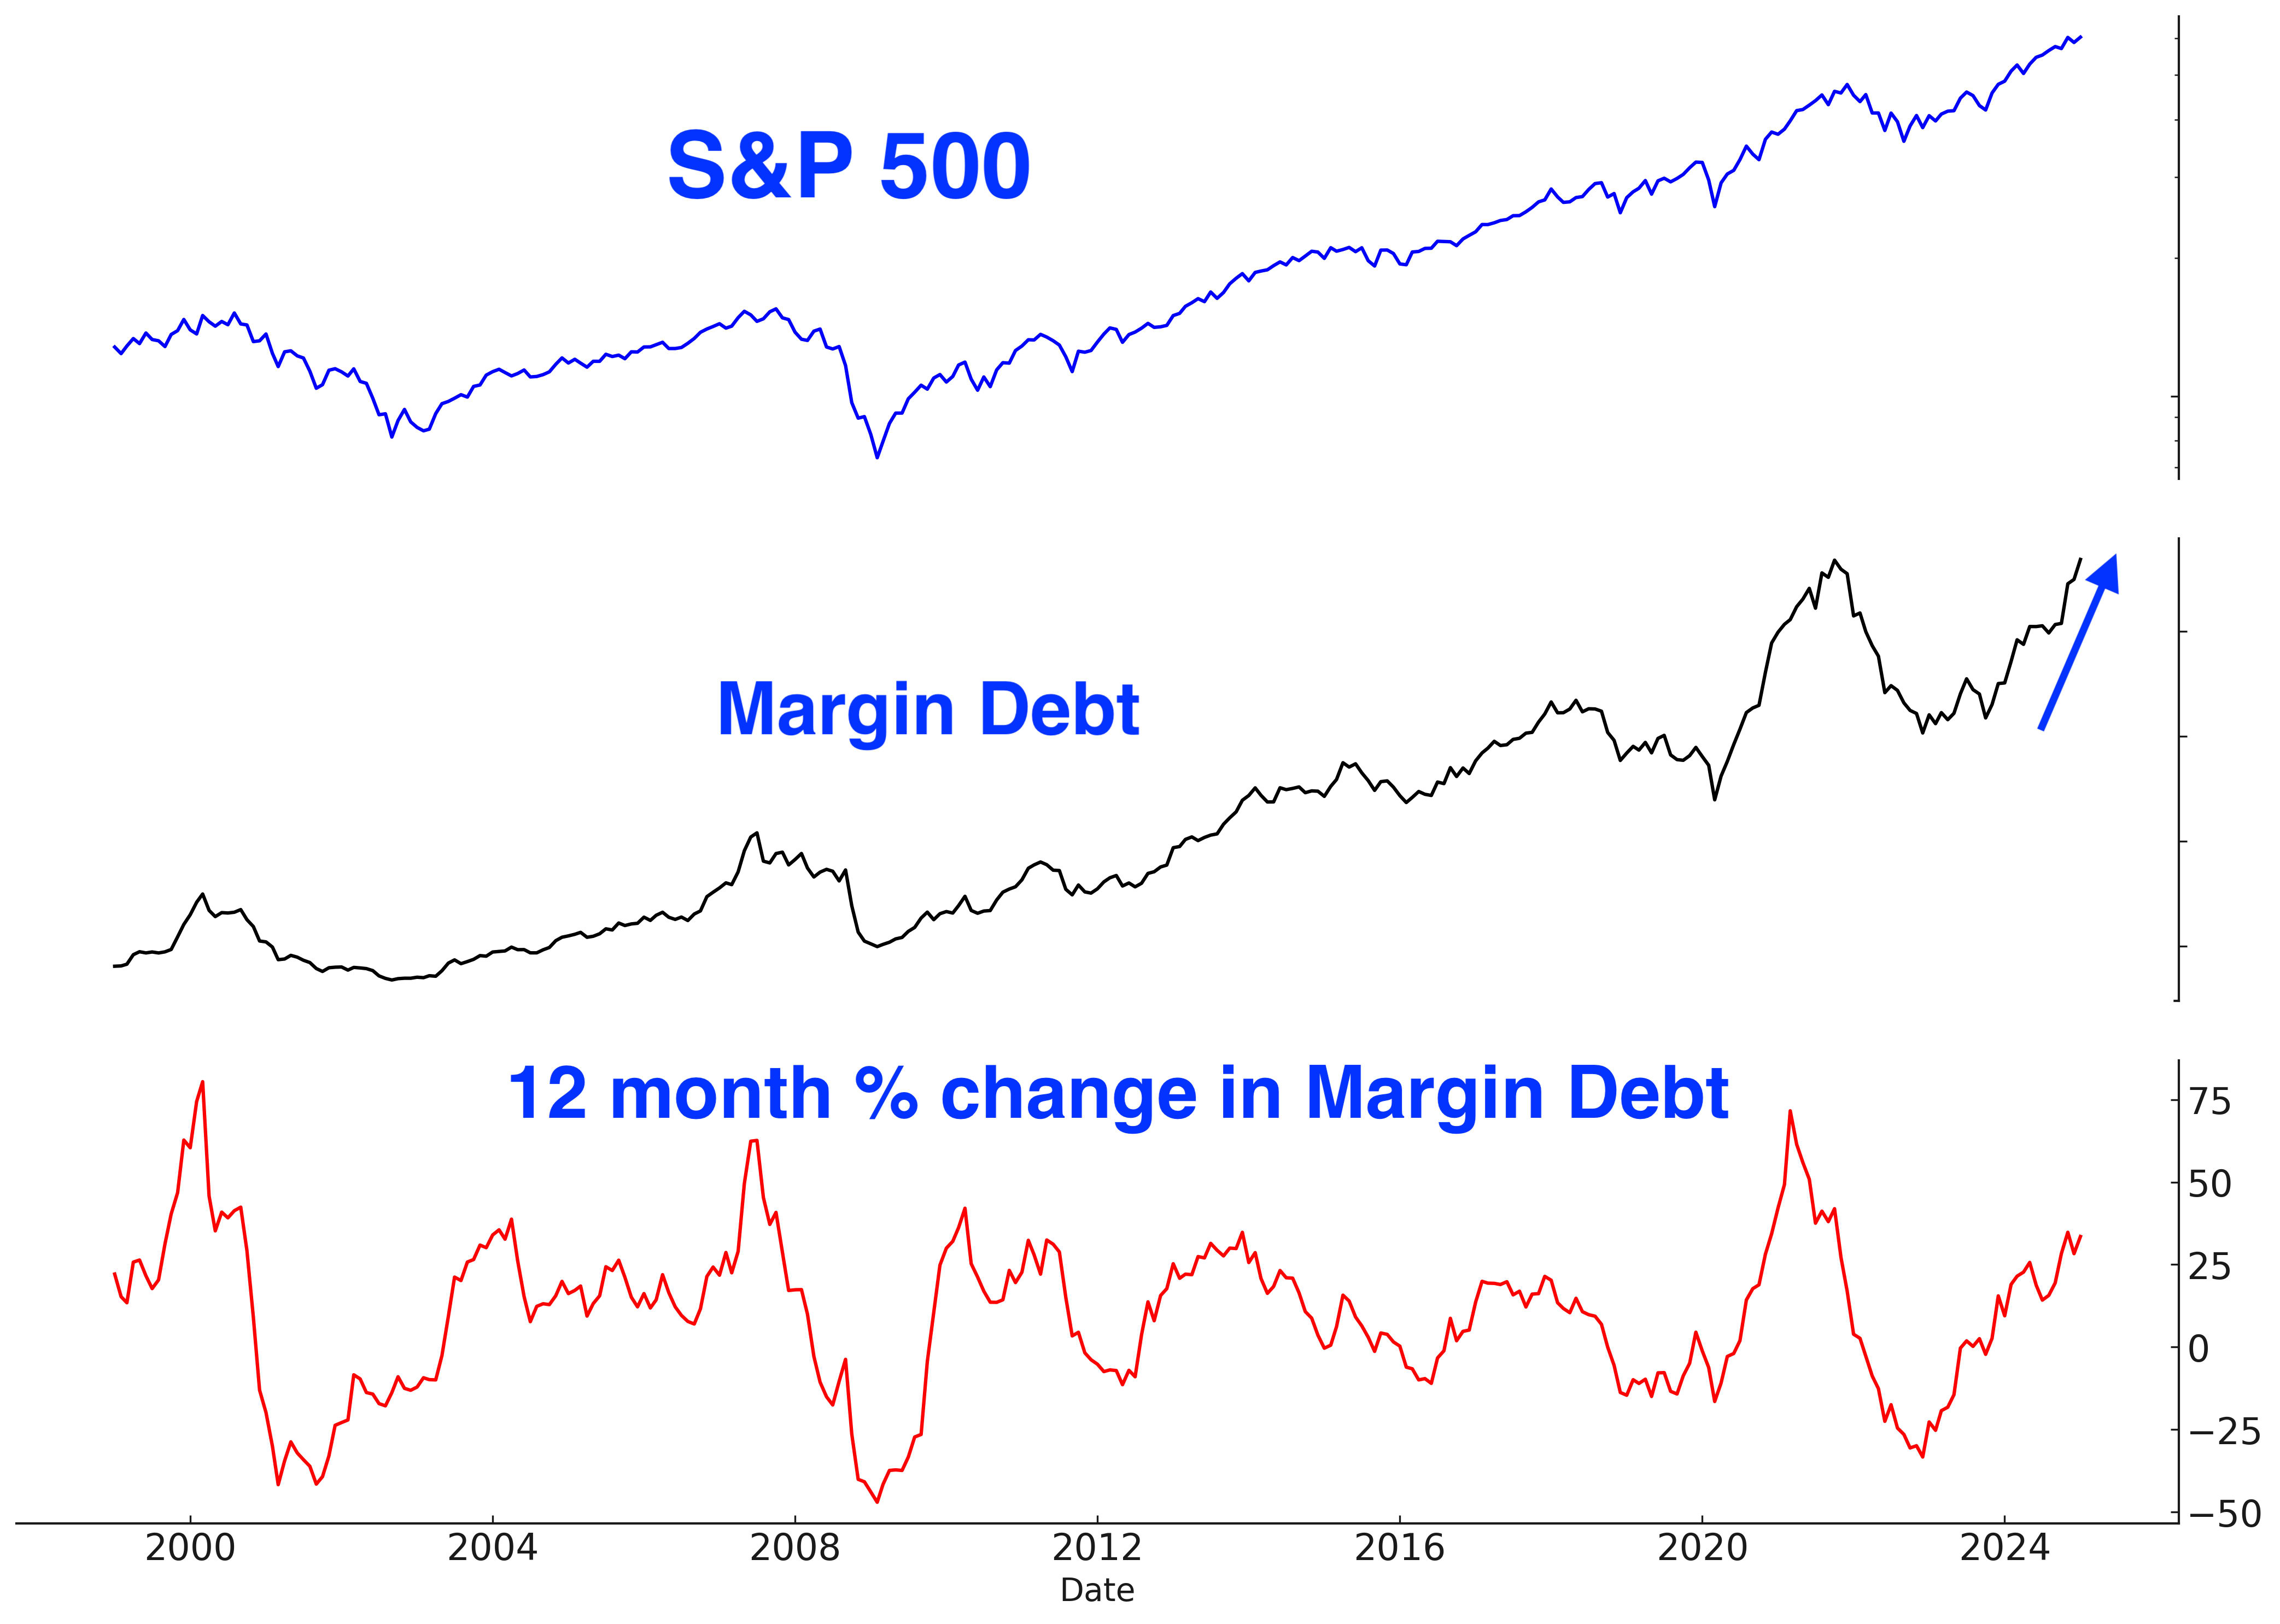
Margin Debt
Margin debt continues to increase. This is a long term concern:
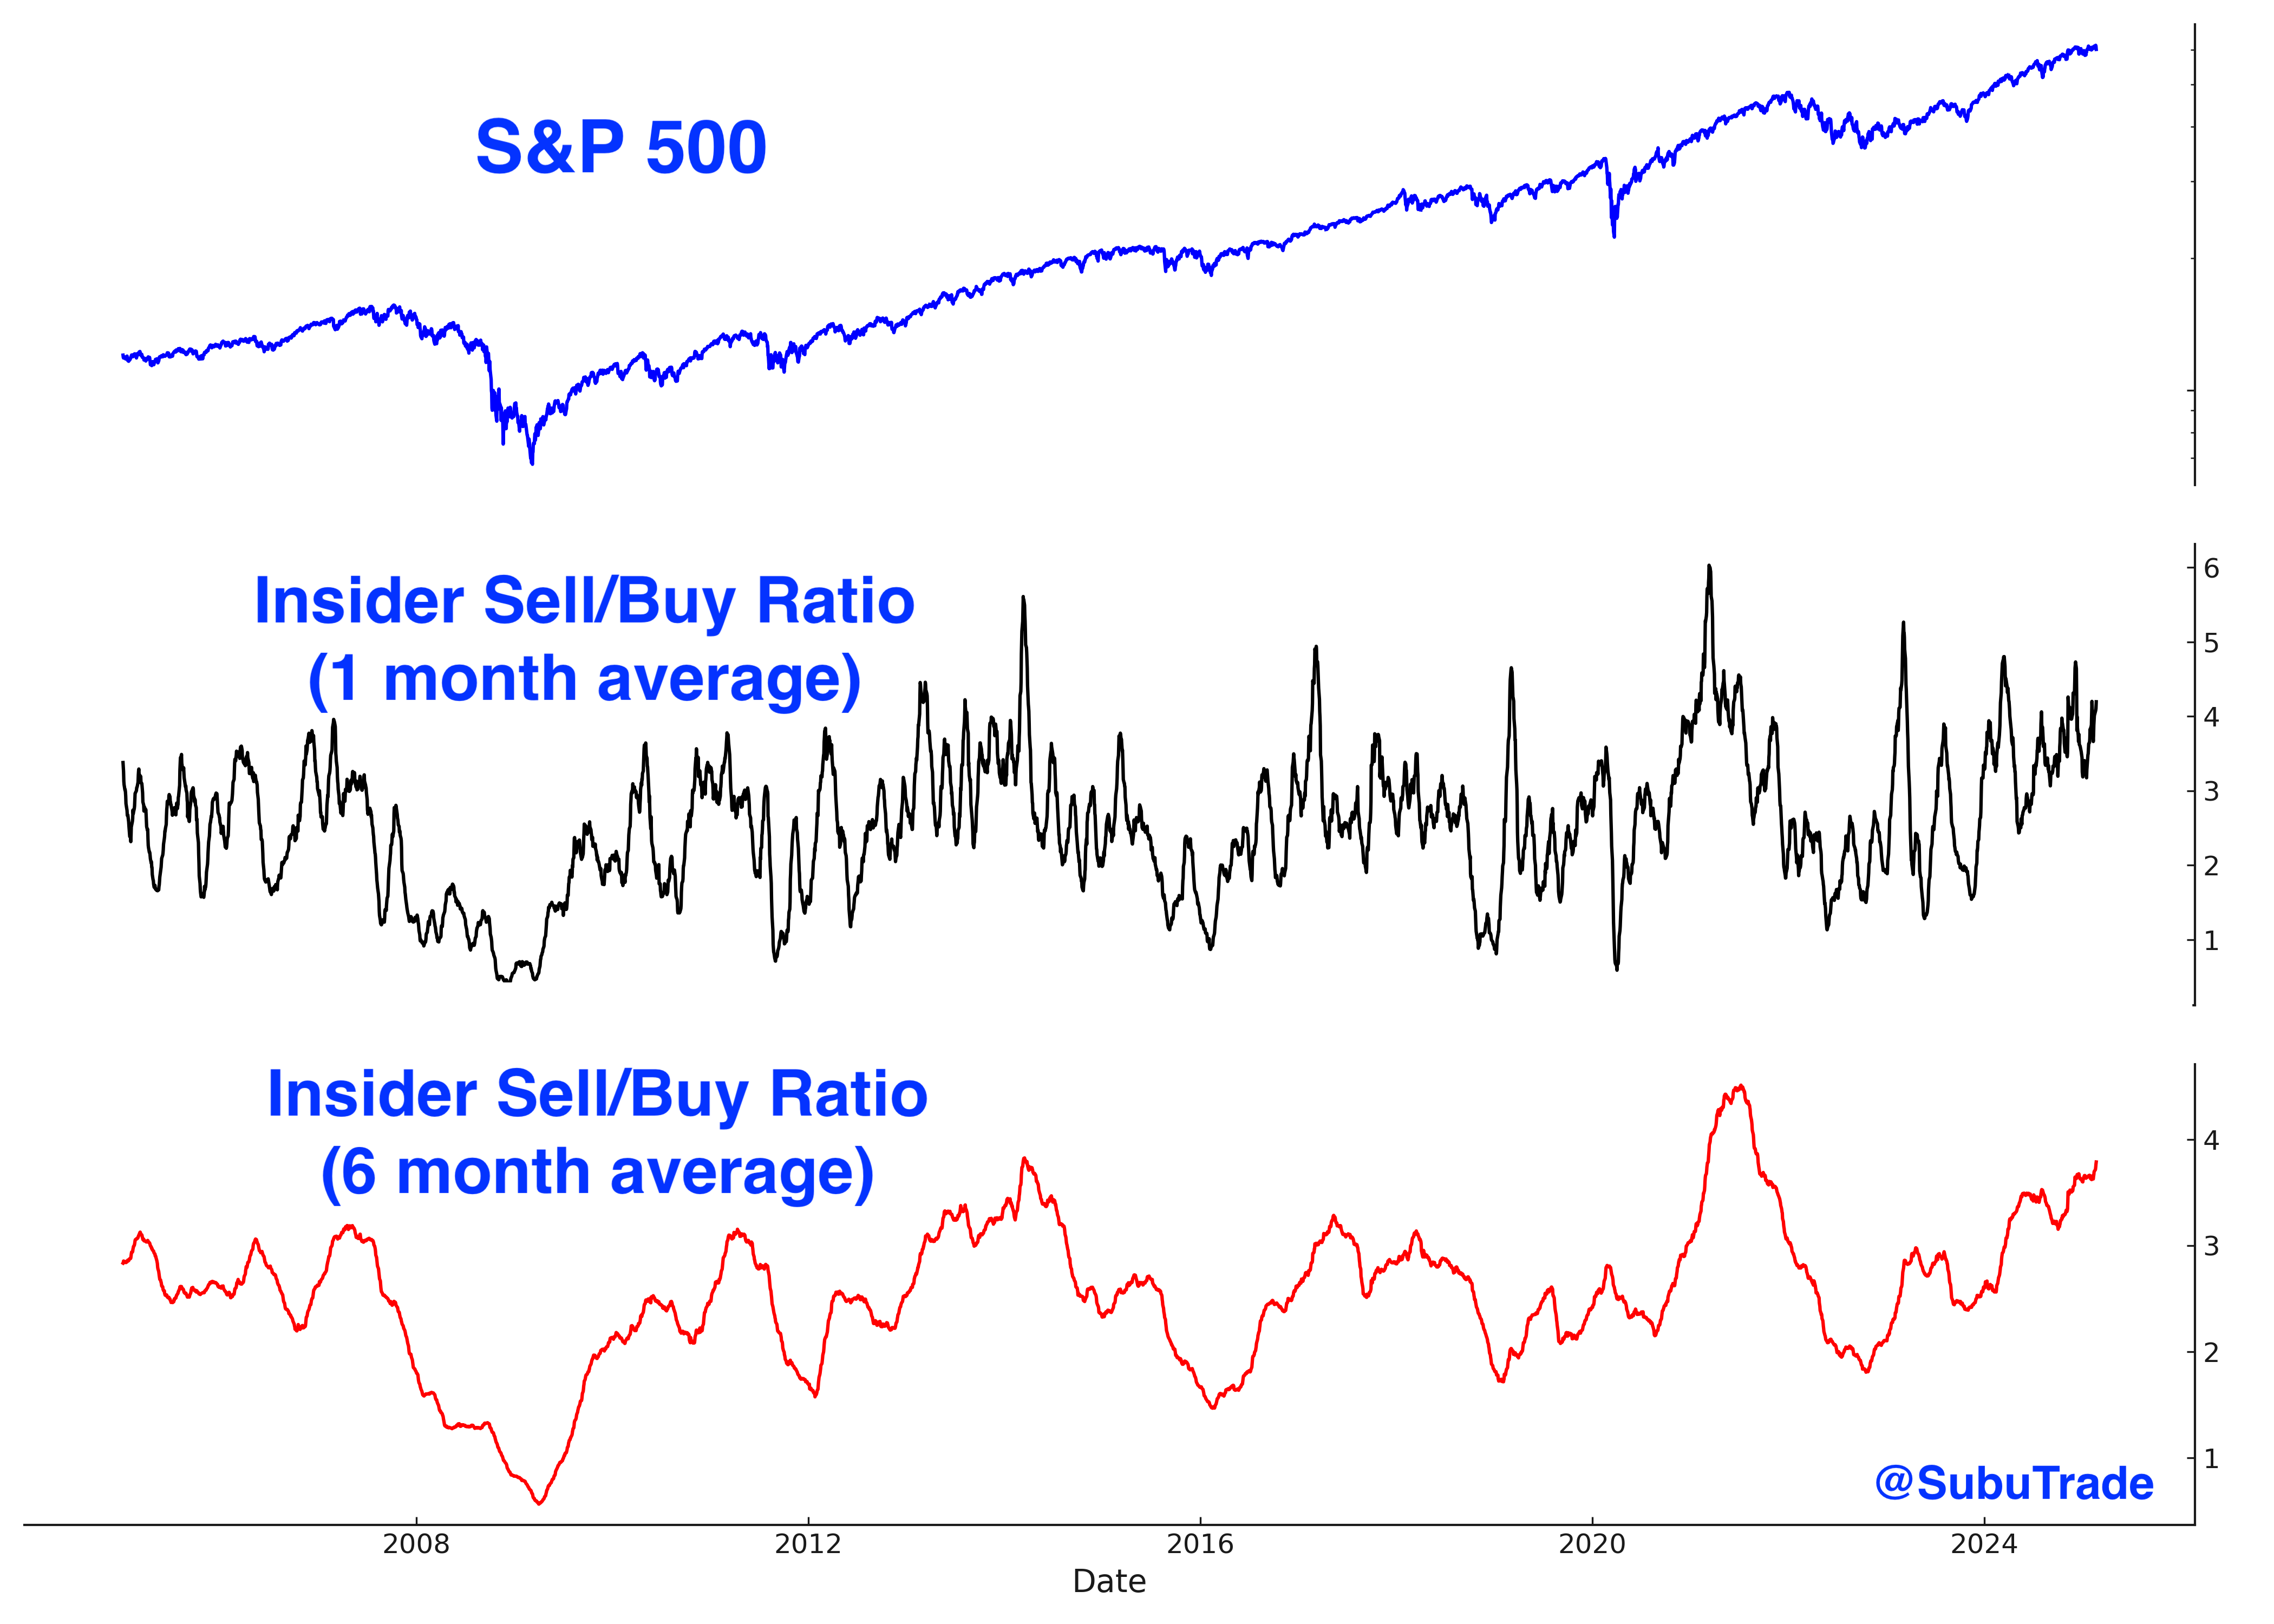
Corporate Insiders
Corporate insiders continue to use elevated stock prices as opportunities to sell equities.
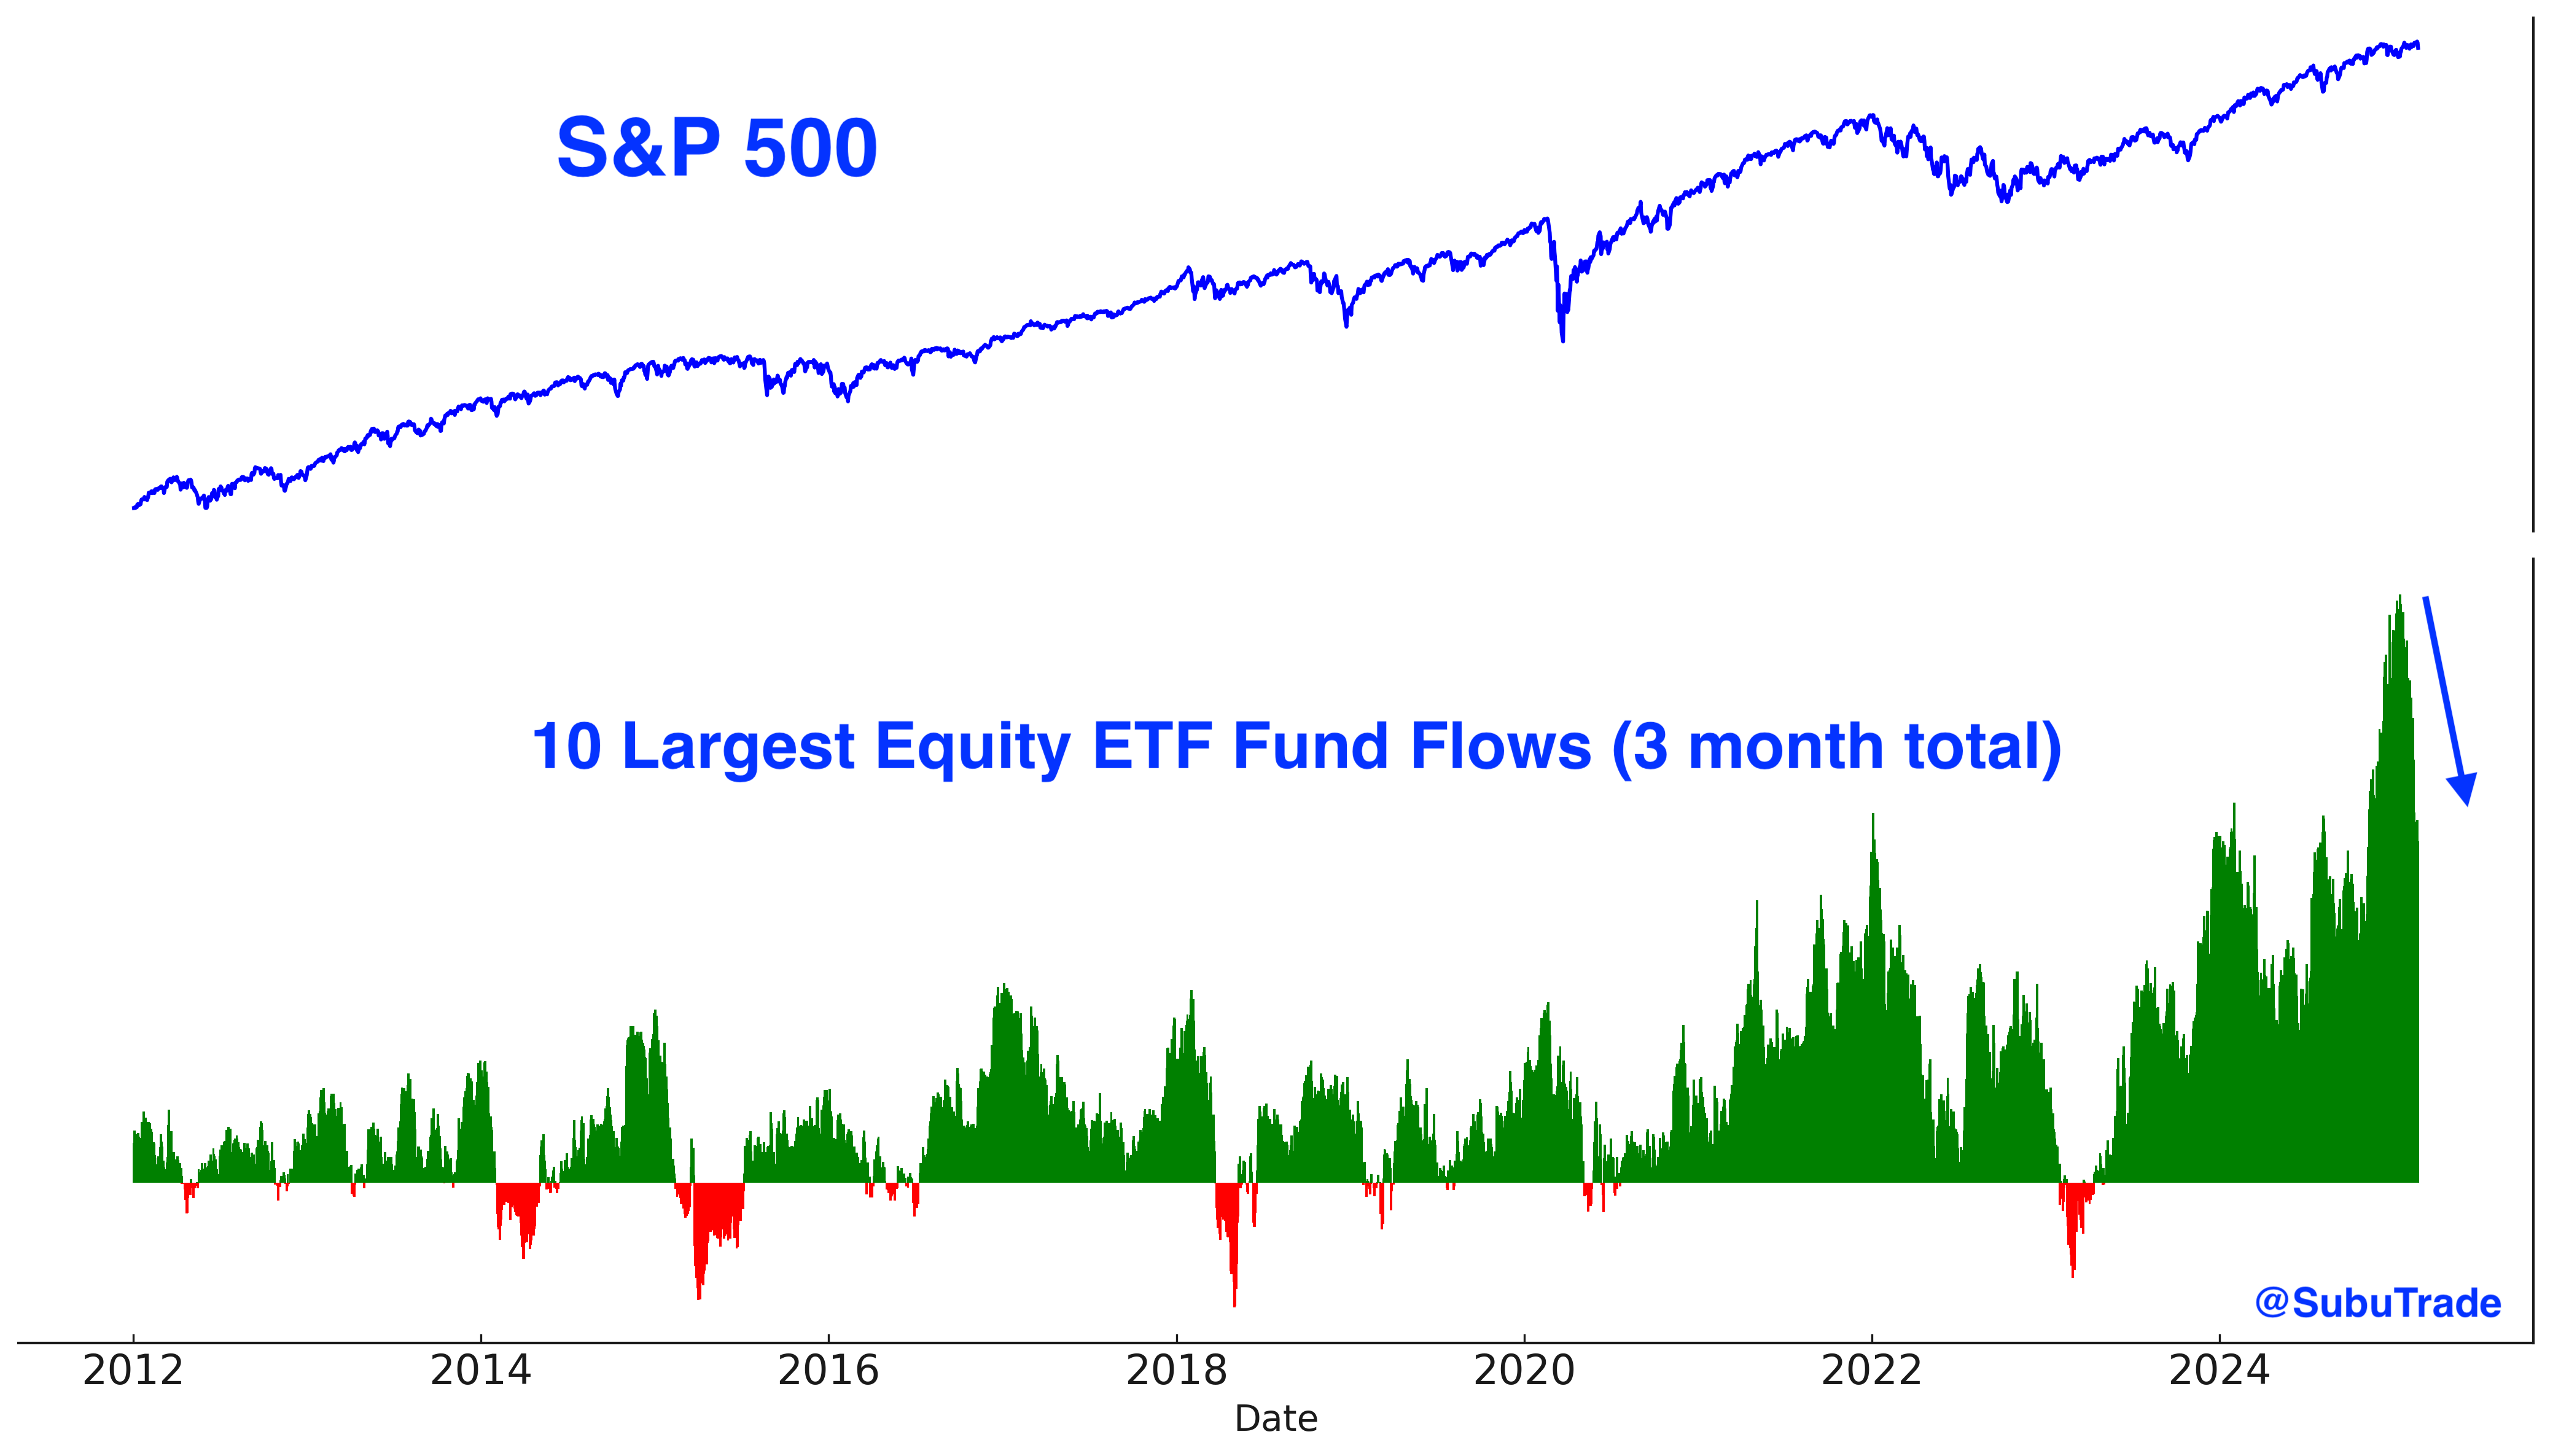
Fund Flows
While inflows remain elevated, they are declining. The U.S. stock market’s prolonged sideways price action appears to be unnerving investors:
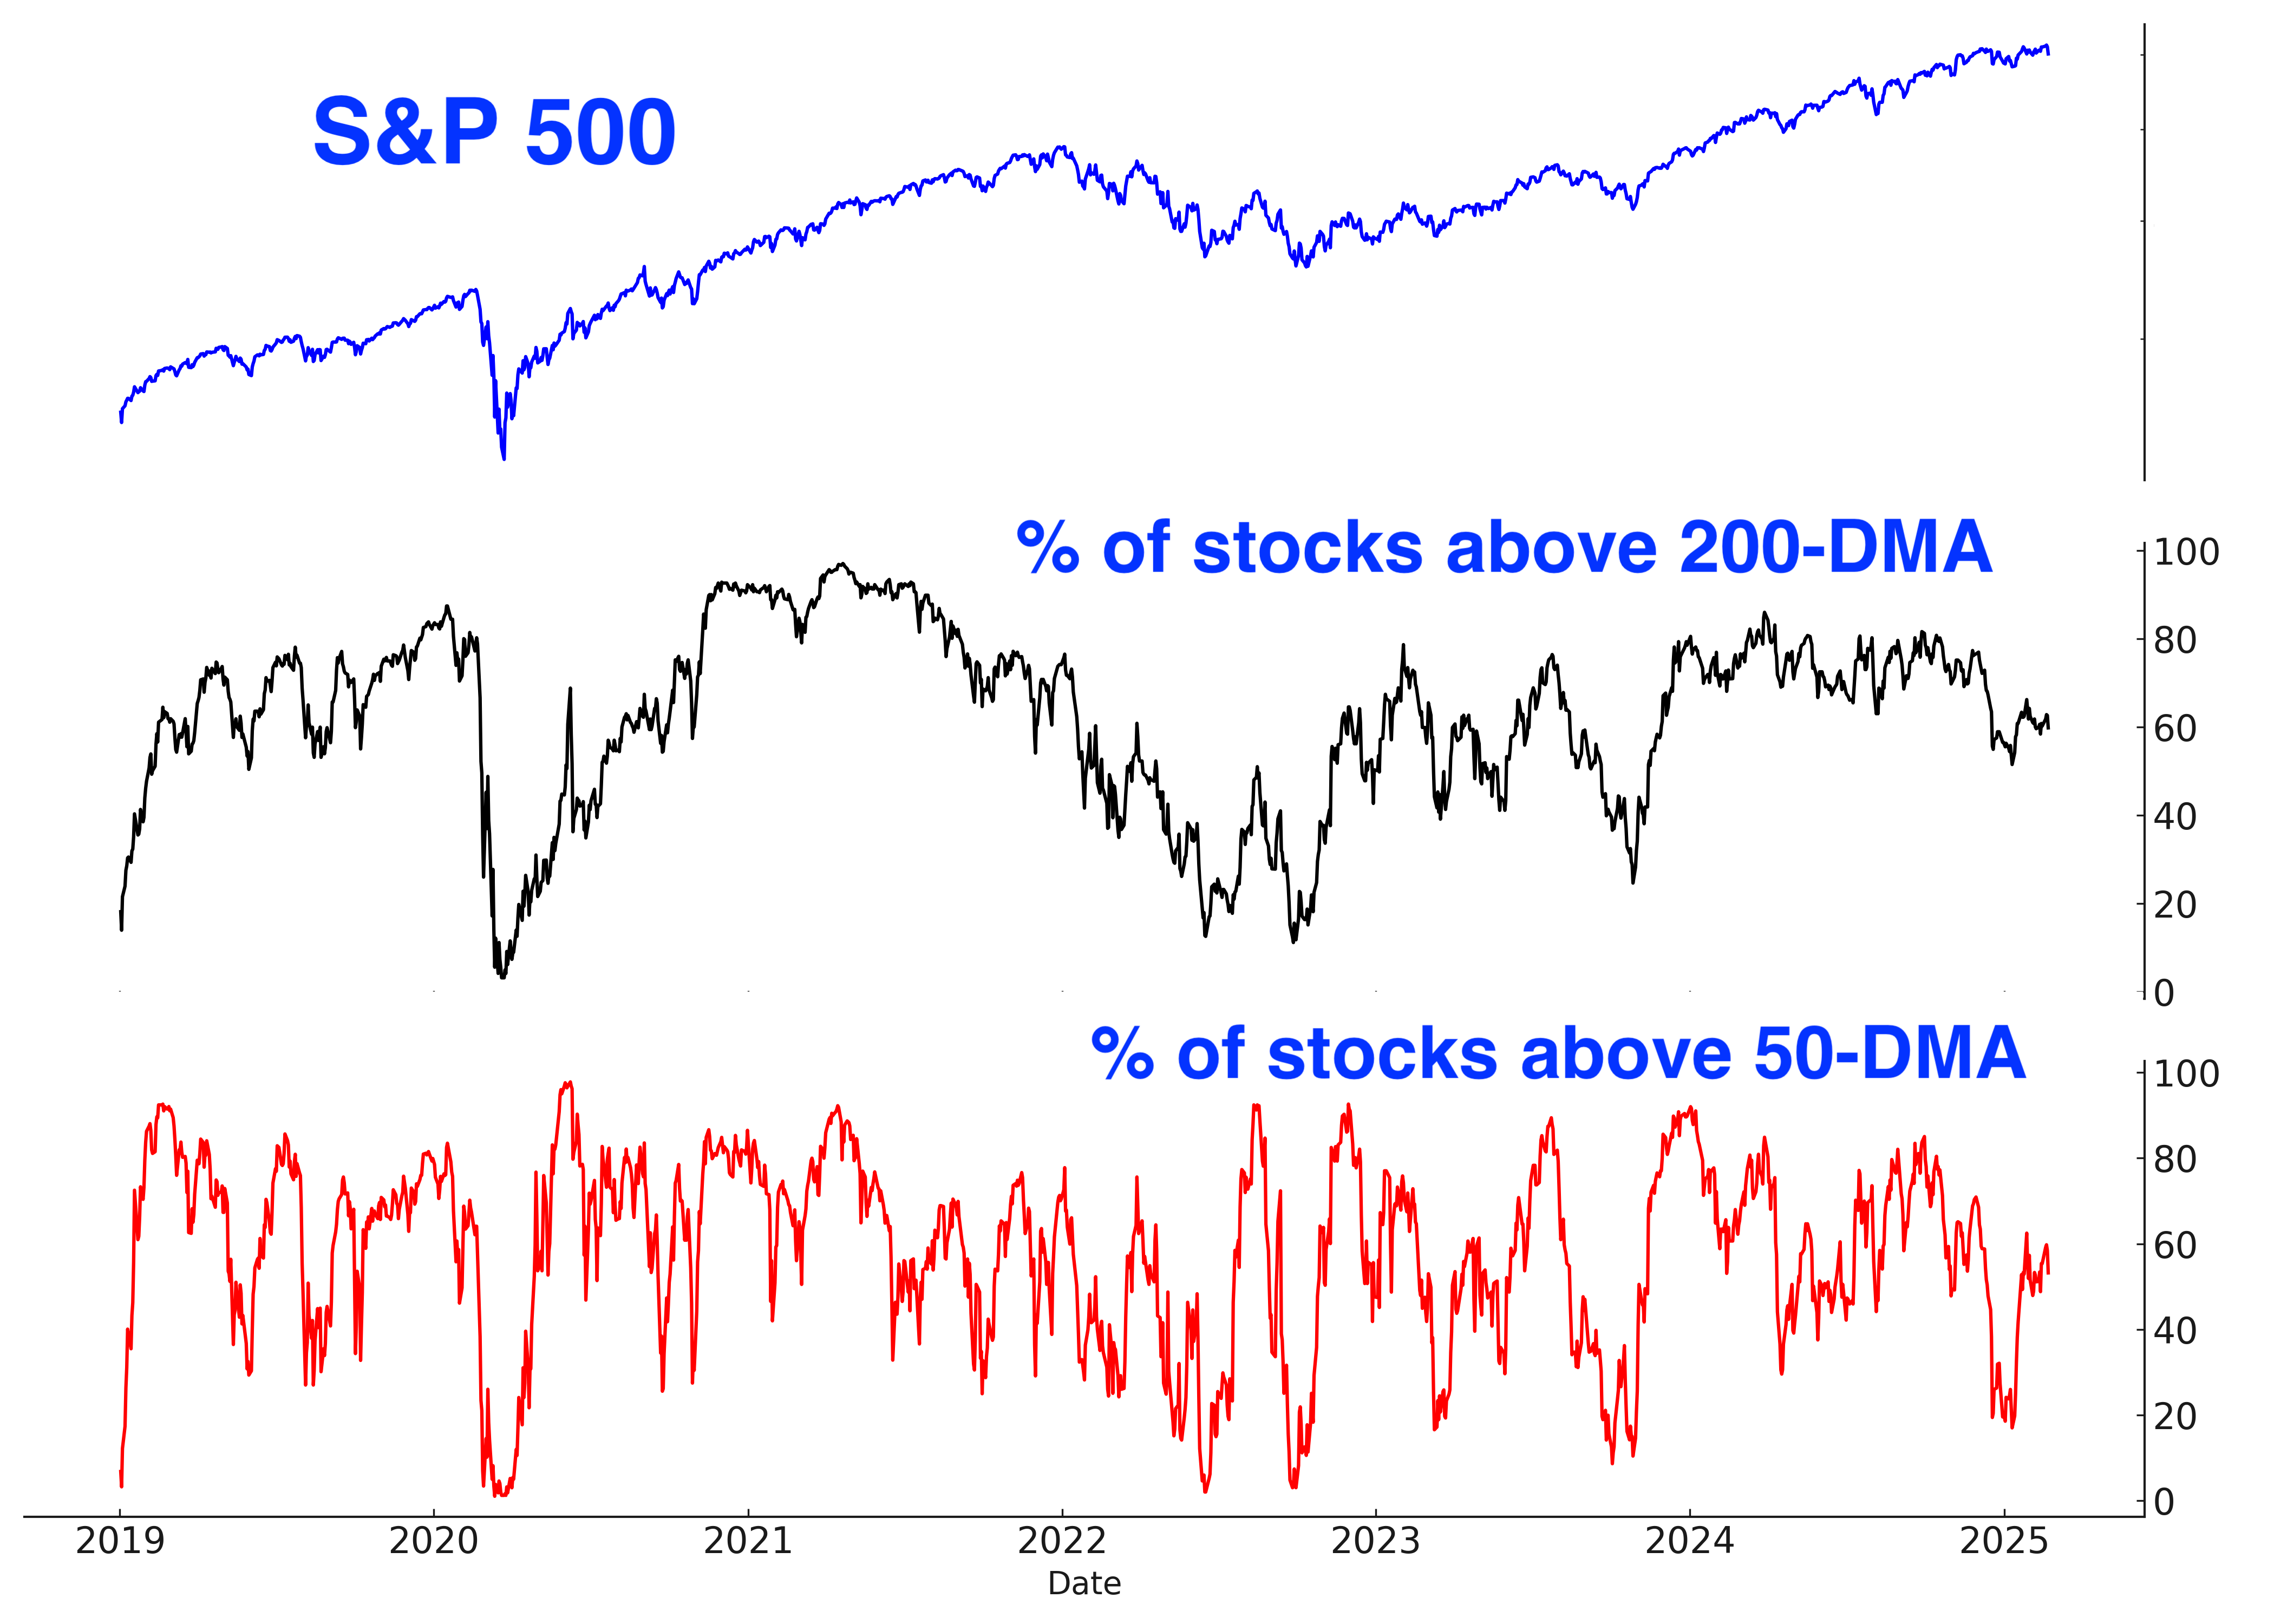
Breadth
Breadth is neutral. Here’s the % of S&P 500 stocks above their 200 and 50 day moving averages:
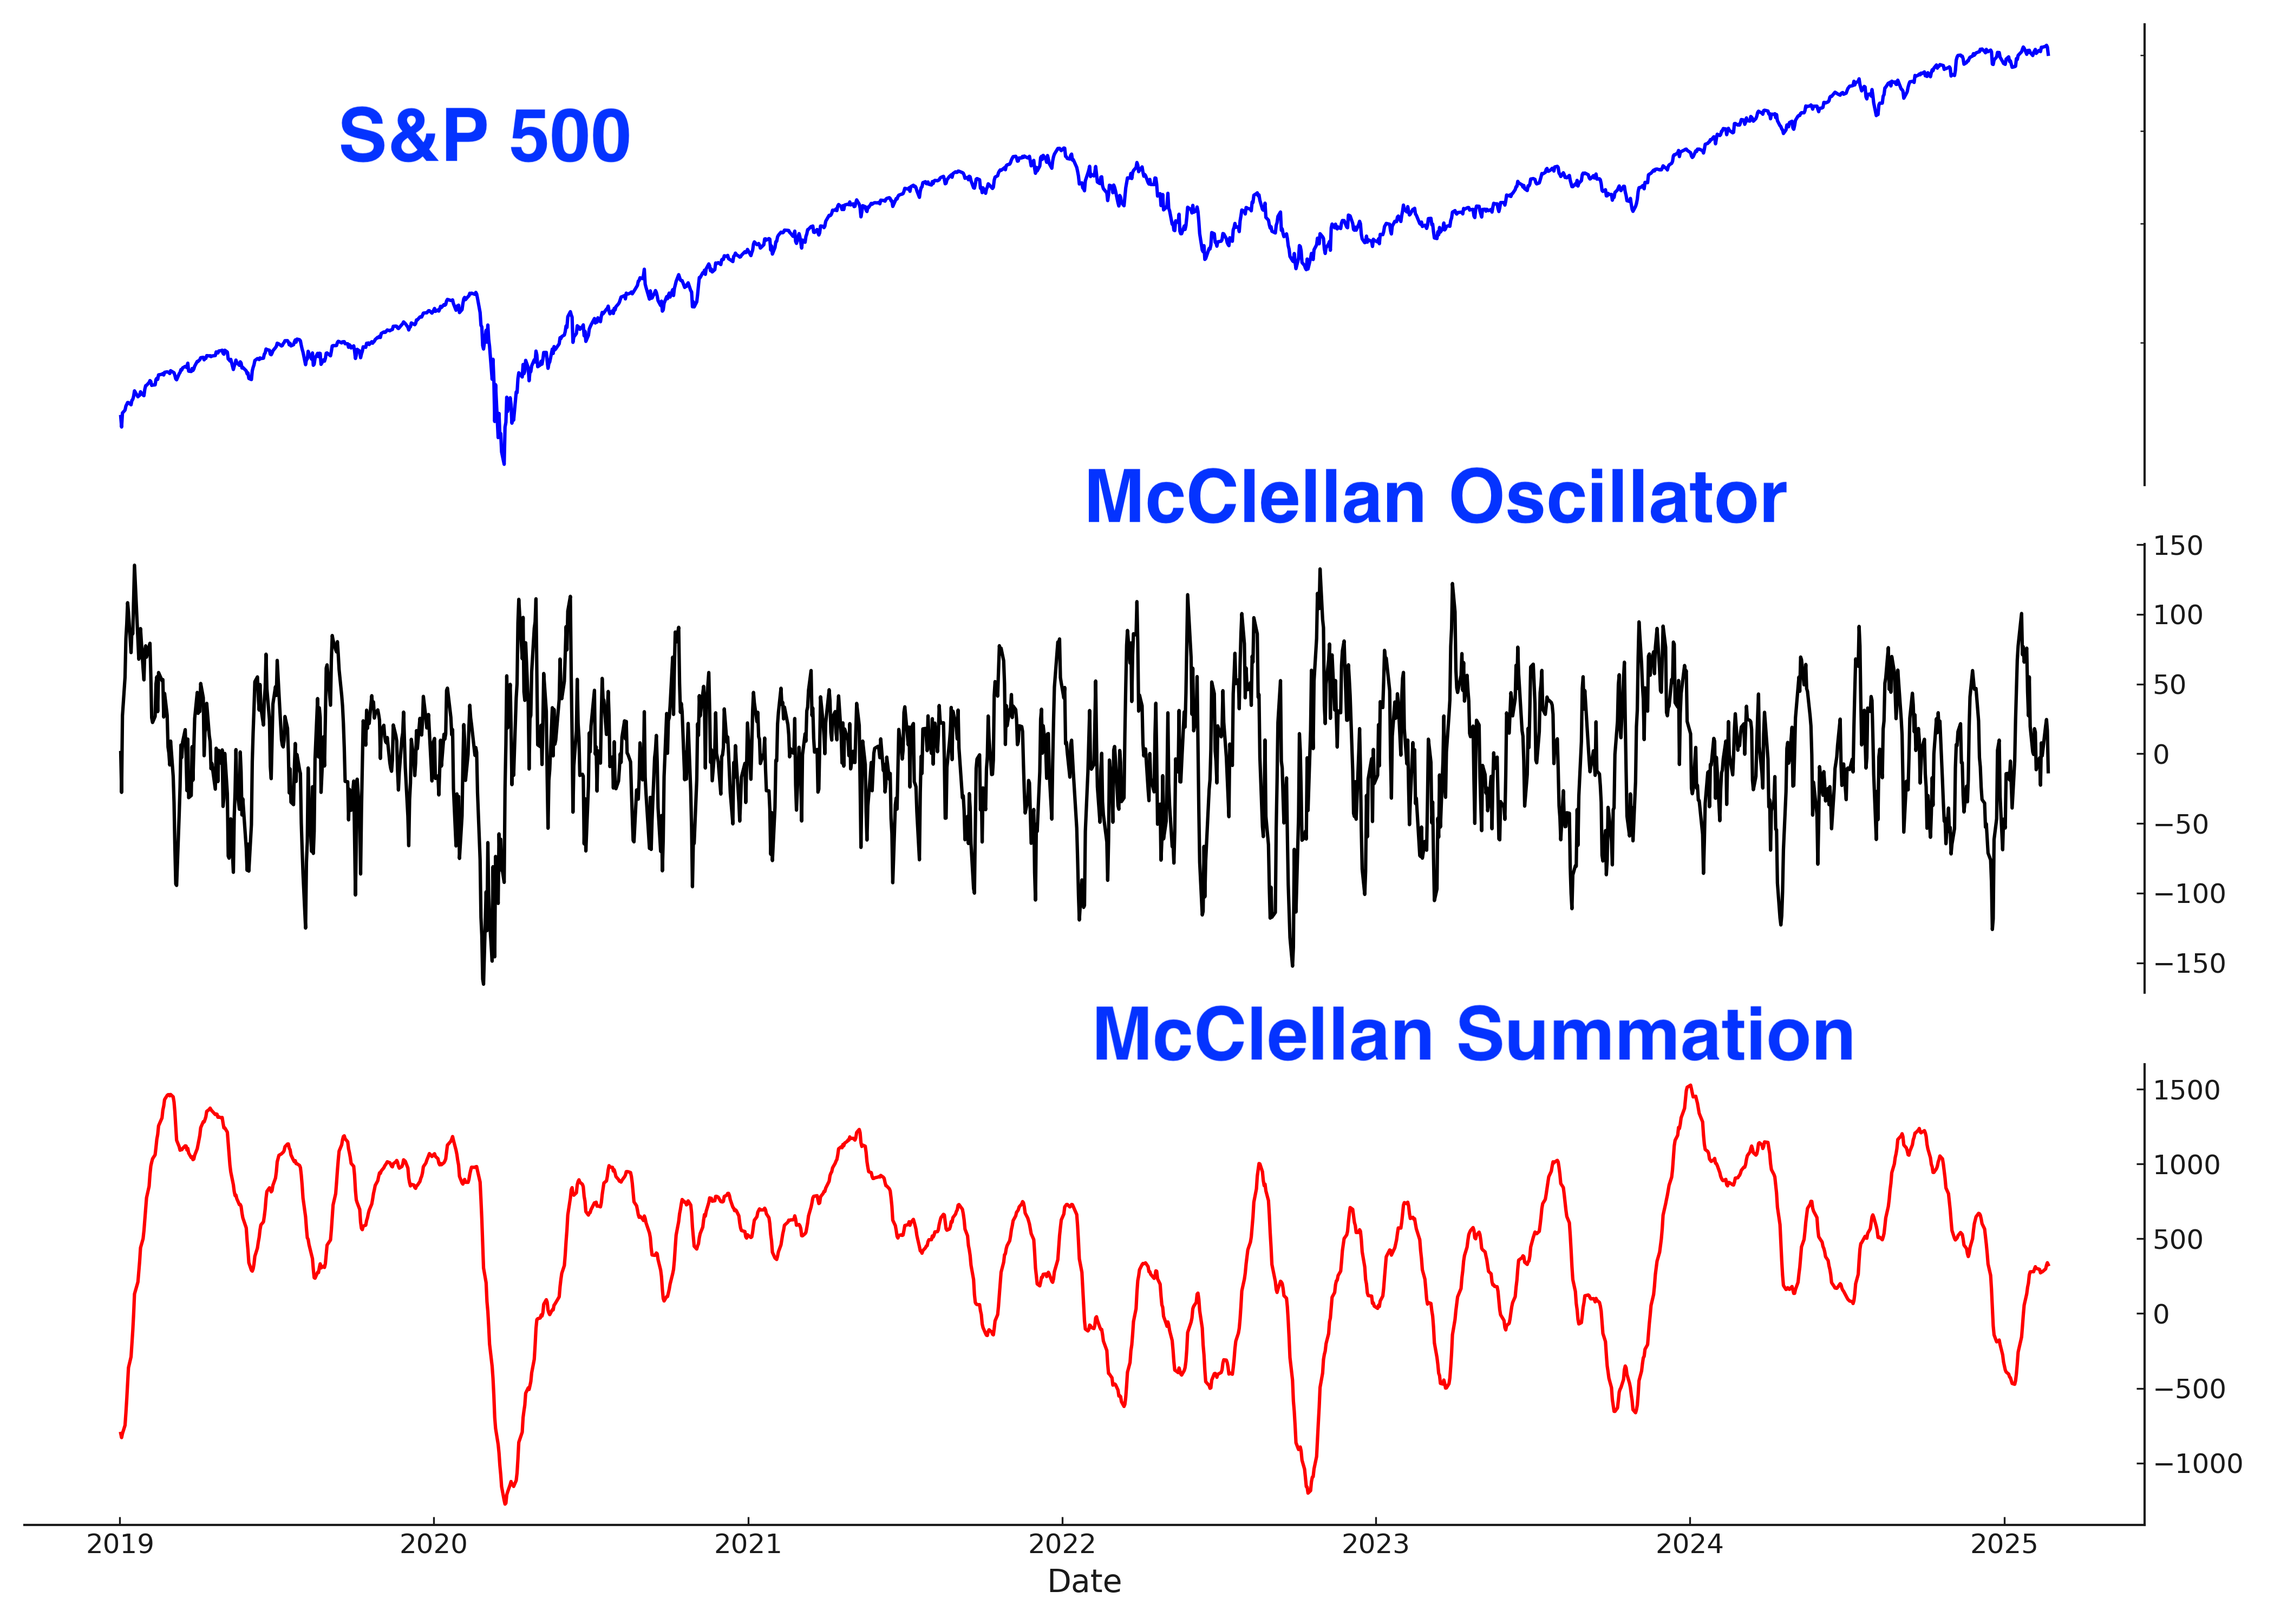
Here’s the S&P 500 McClellan Oscillator and McClellan Summation Index:
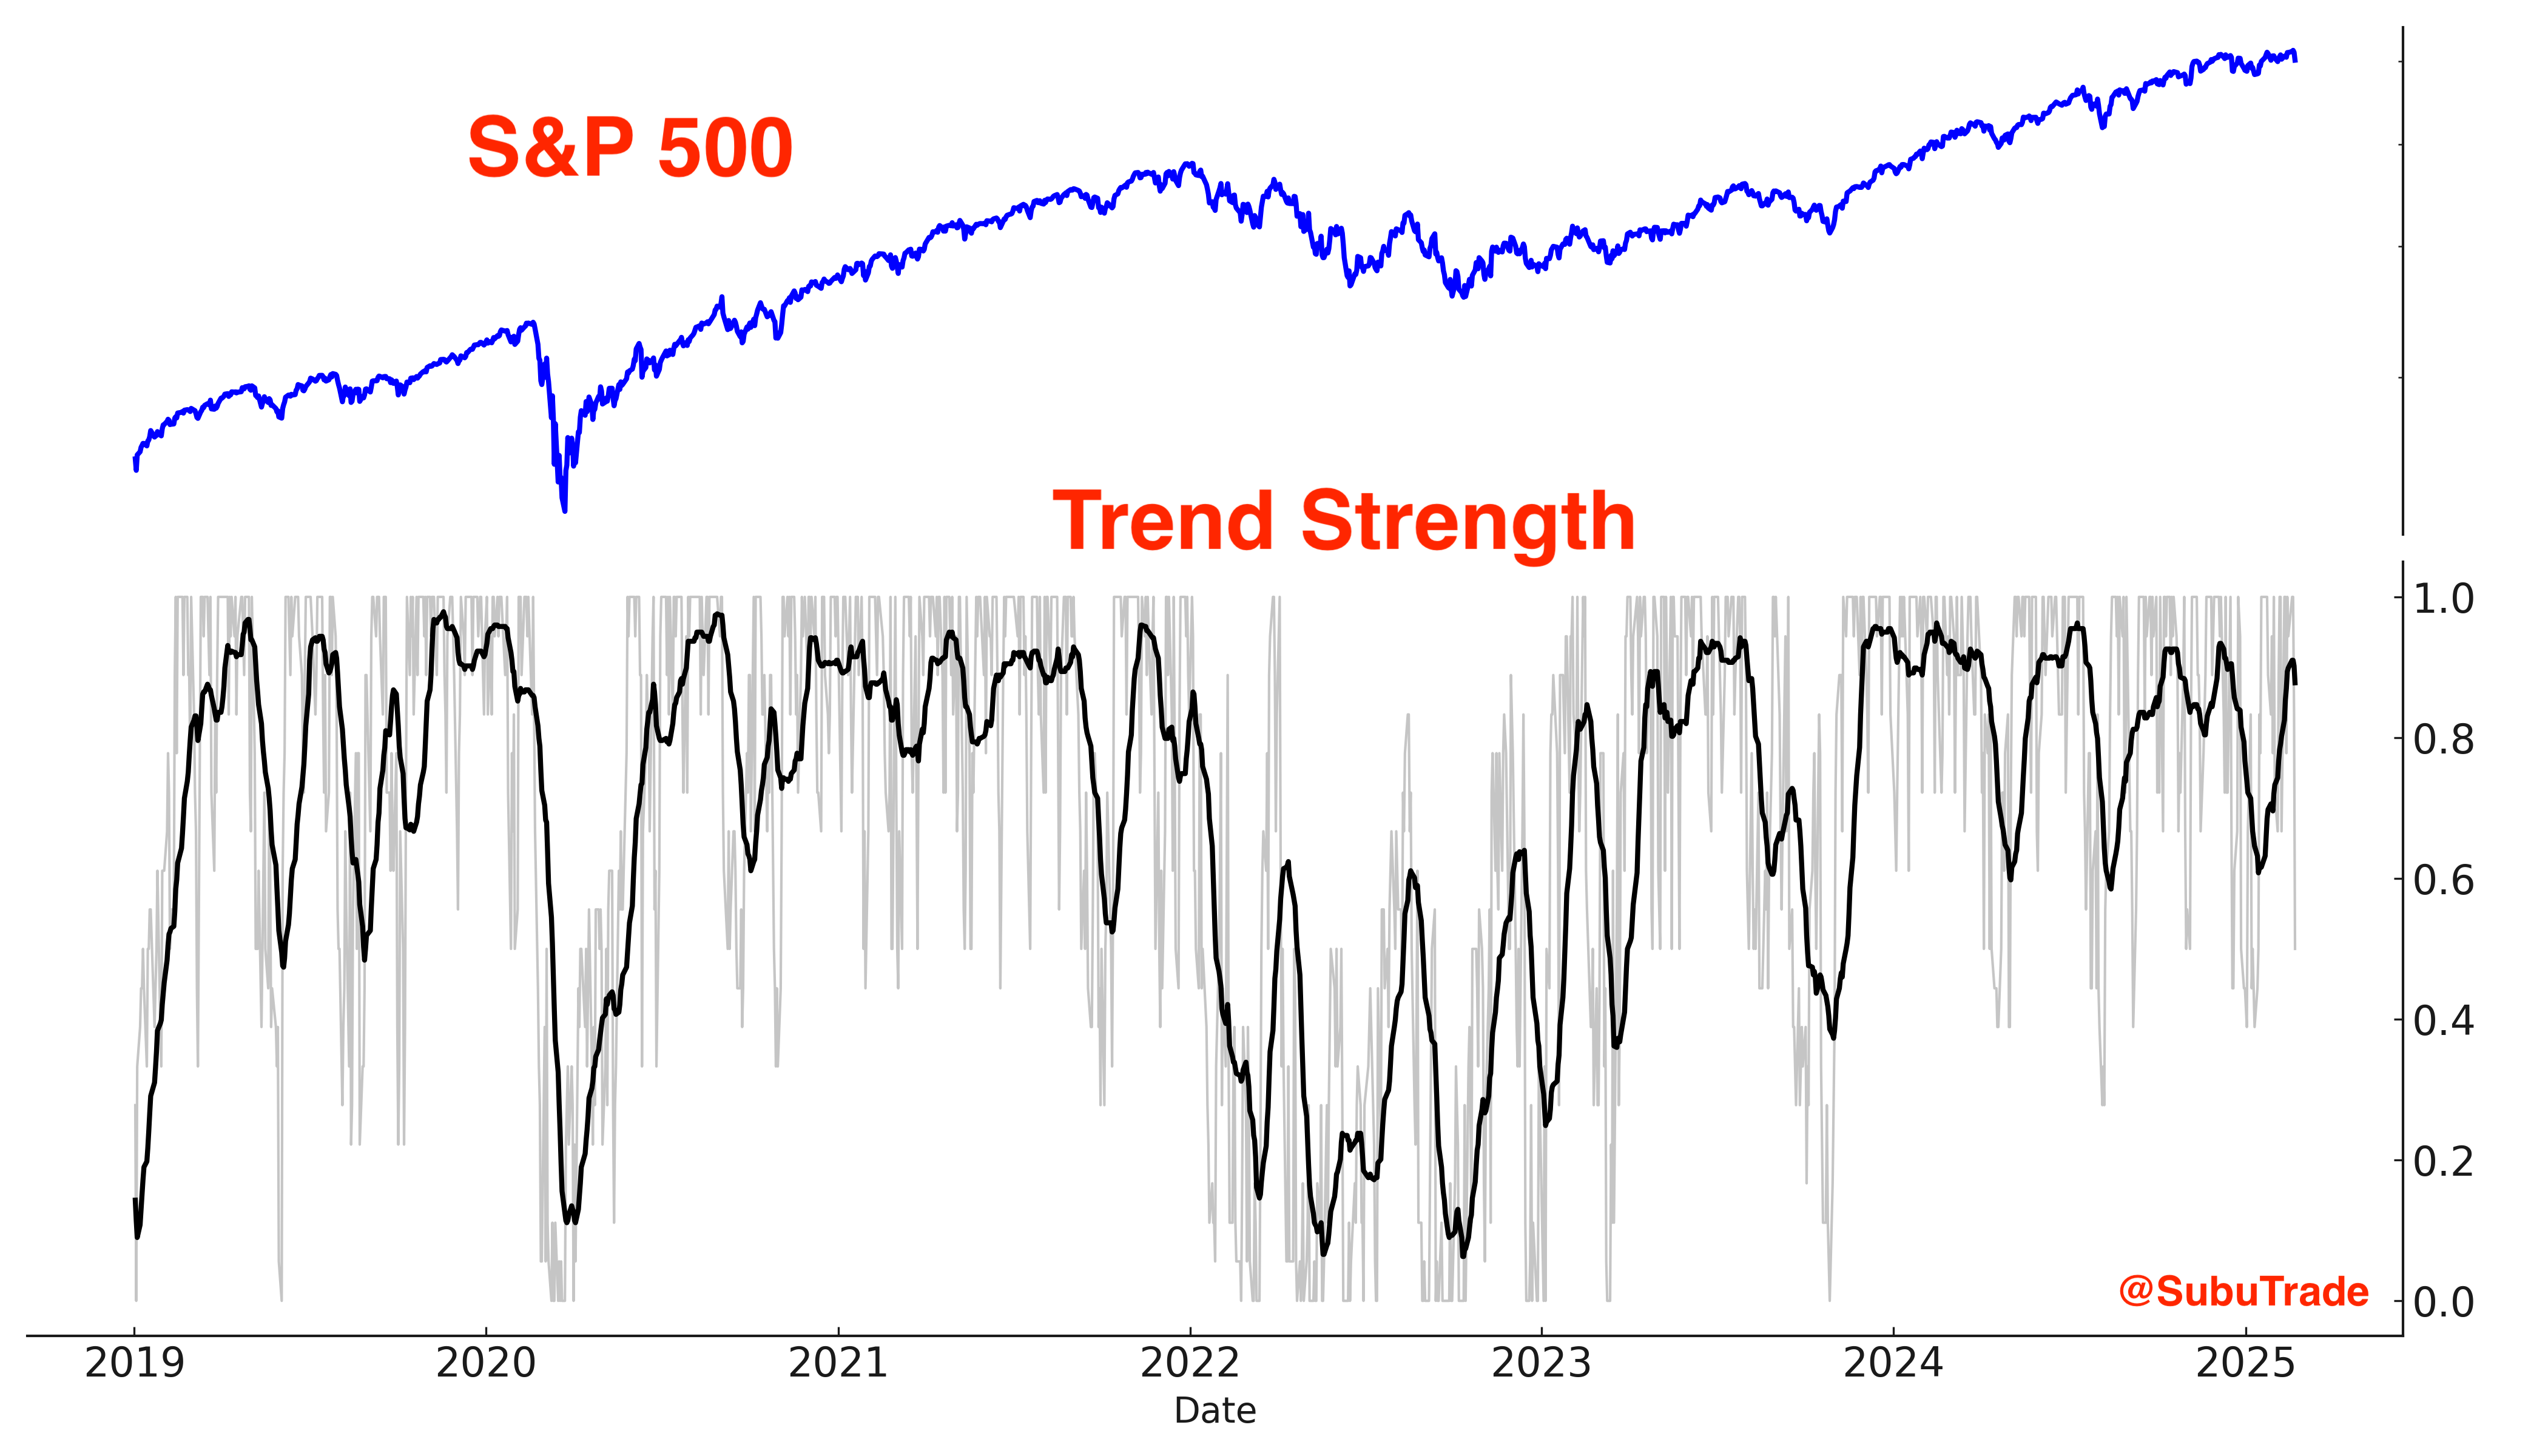
Trend
Despite all the long term concerns, the trend is your friend until it ends. The U.S. stock market remains in an Up Trend for the time being.
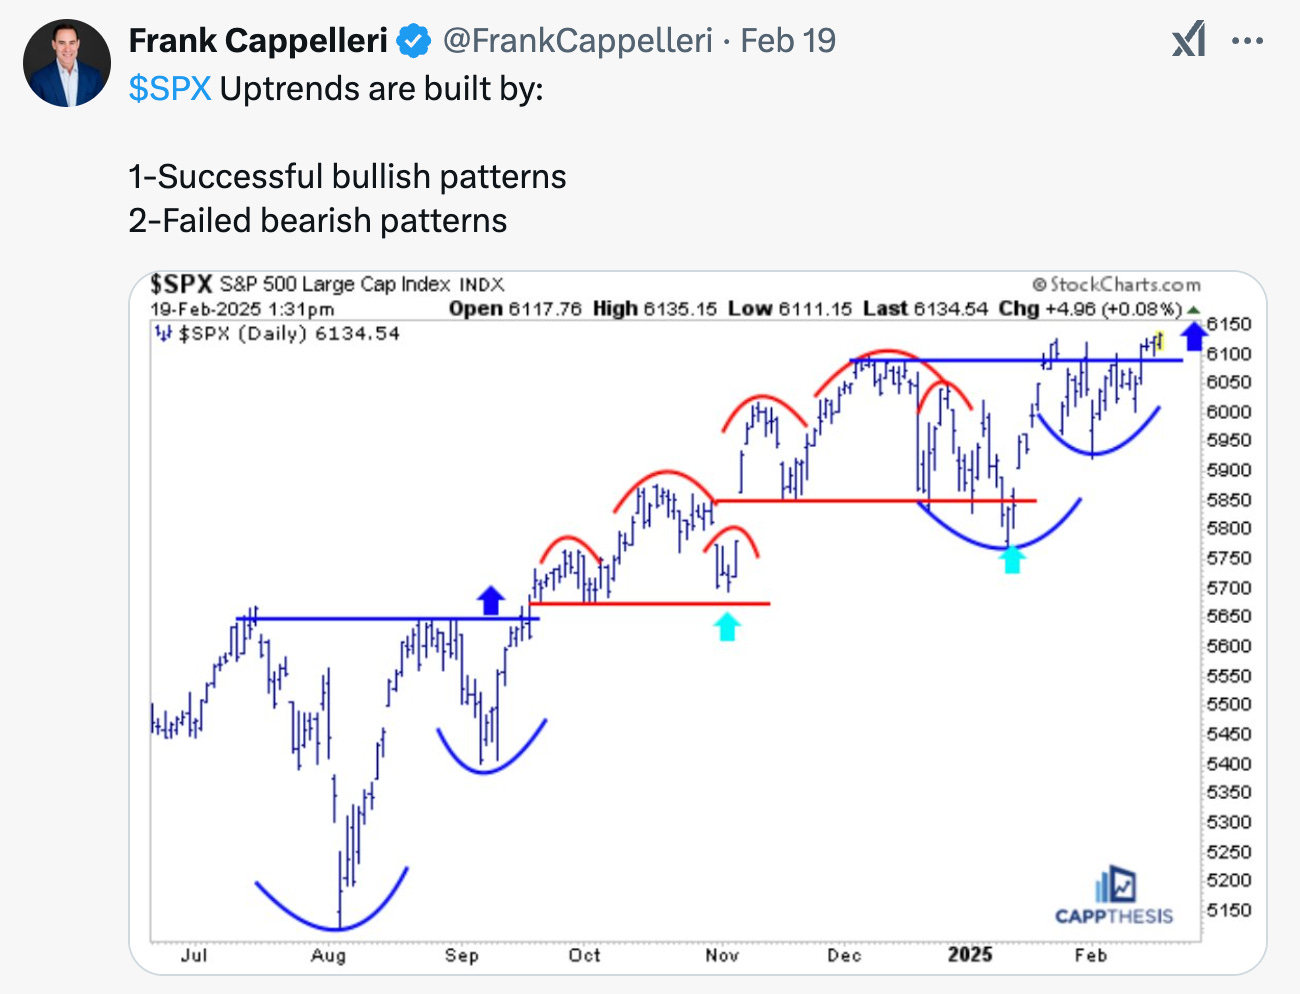
Frank Cappelleri recently shared a similar perspective on X/Twitter. The simple fact is that the S&P 500 remains in an Up trend. If you’re not already following Frank on X/Twitter, I highly recommend that you do so!
With that being said…
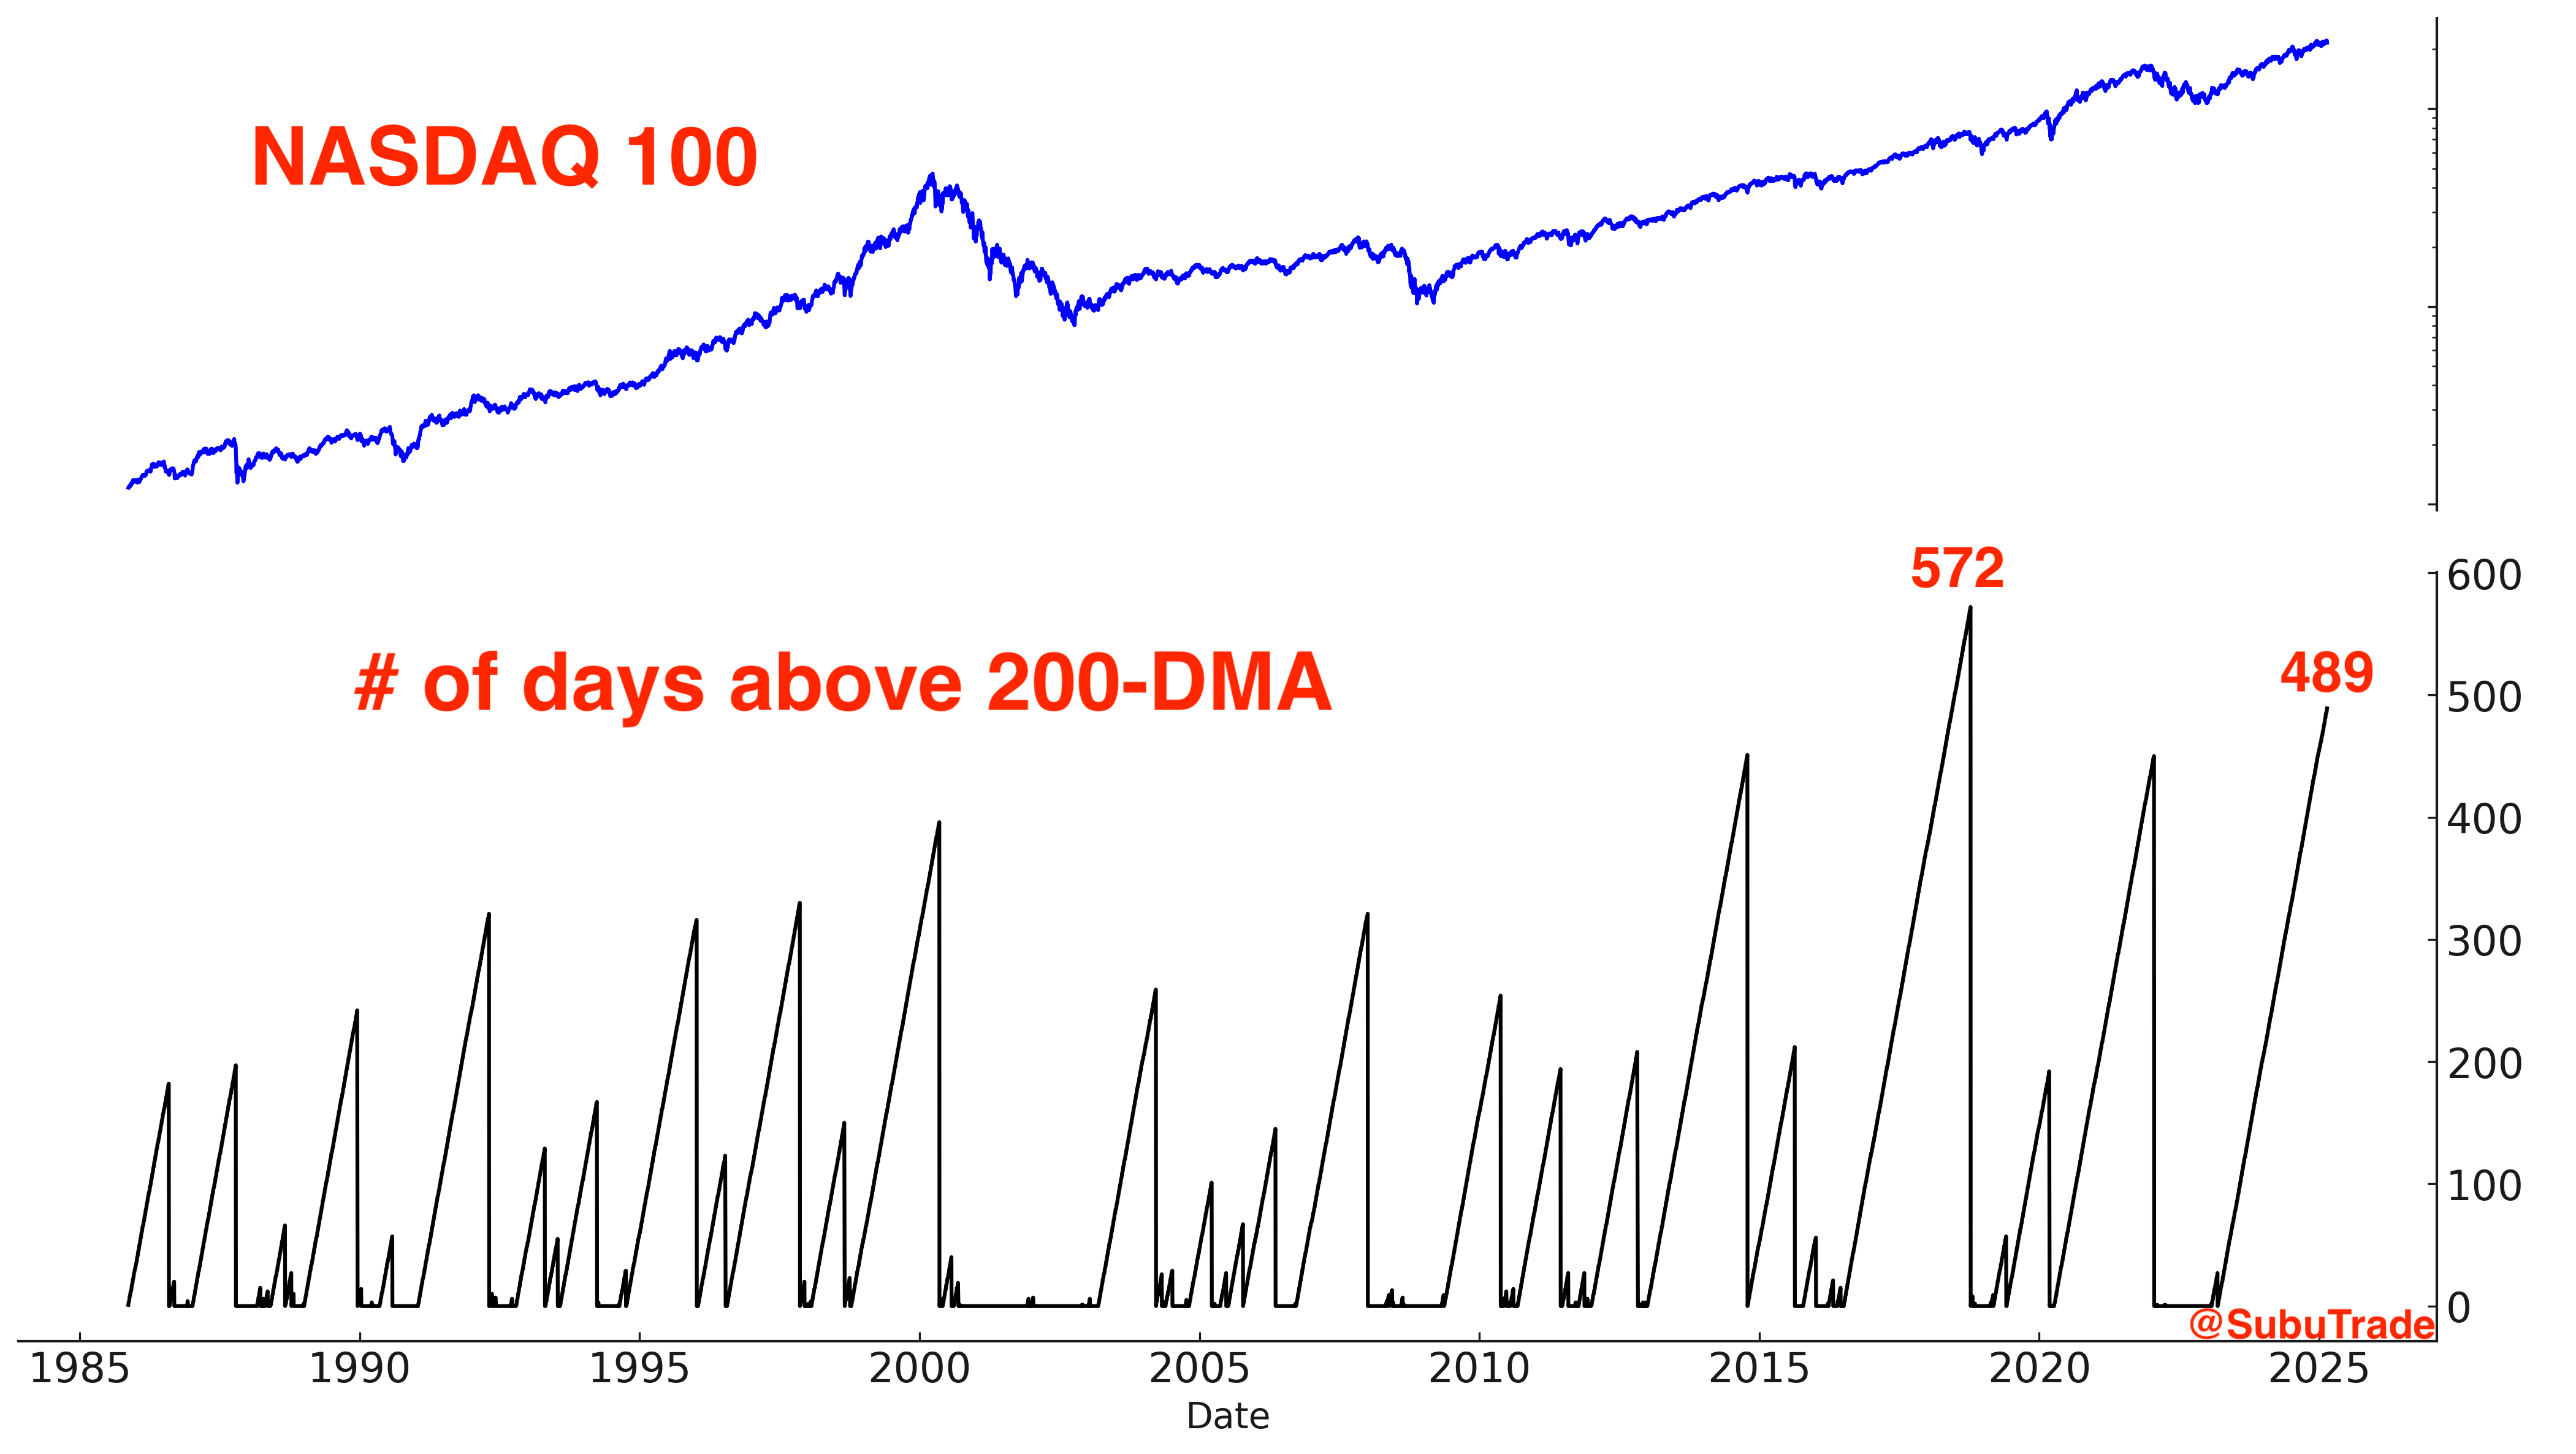
At some point this year, both the NASDAQ 100 and S&P 500 are likely to reconnect with their 200 day moving averages.
2015 scenario
For now, my base case for the S&P 500 continues to be a 2015-like scenario: lots of sideways volatility (with marginal new highs), followed by a larger decline later in the year.
The absence of a strong trend in U.S. equities has led me to focus on opportunities in other markets this year.
Chinese Equities
Chinese equities - in particular Chinese tech stocks - surged in recent weeks.
I remain bullish on China over the intermediate term; however, the risk of a pullback or consolidation is increasing. In response, I reduced my long position on Friday. If Chinese equities decline, I plan to increase my position size, whereas if the rally continues, I will allow the remaining position to run with a trailing stop.
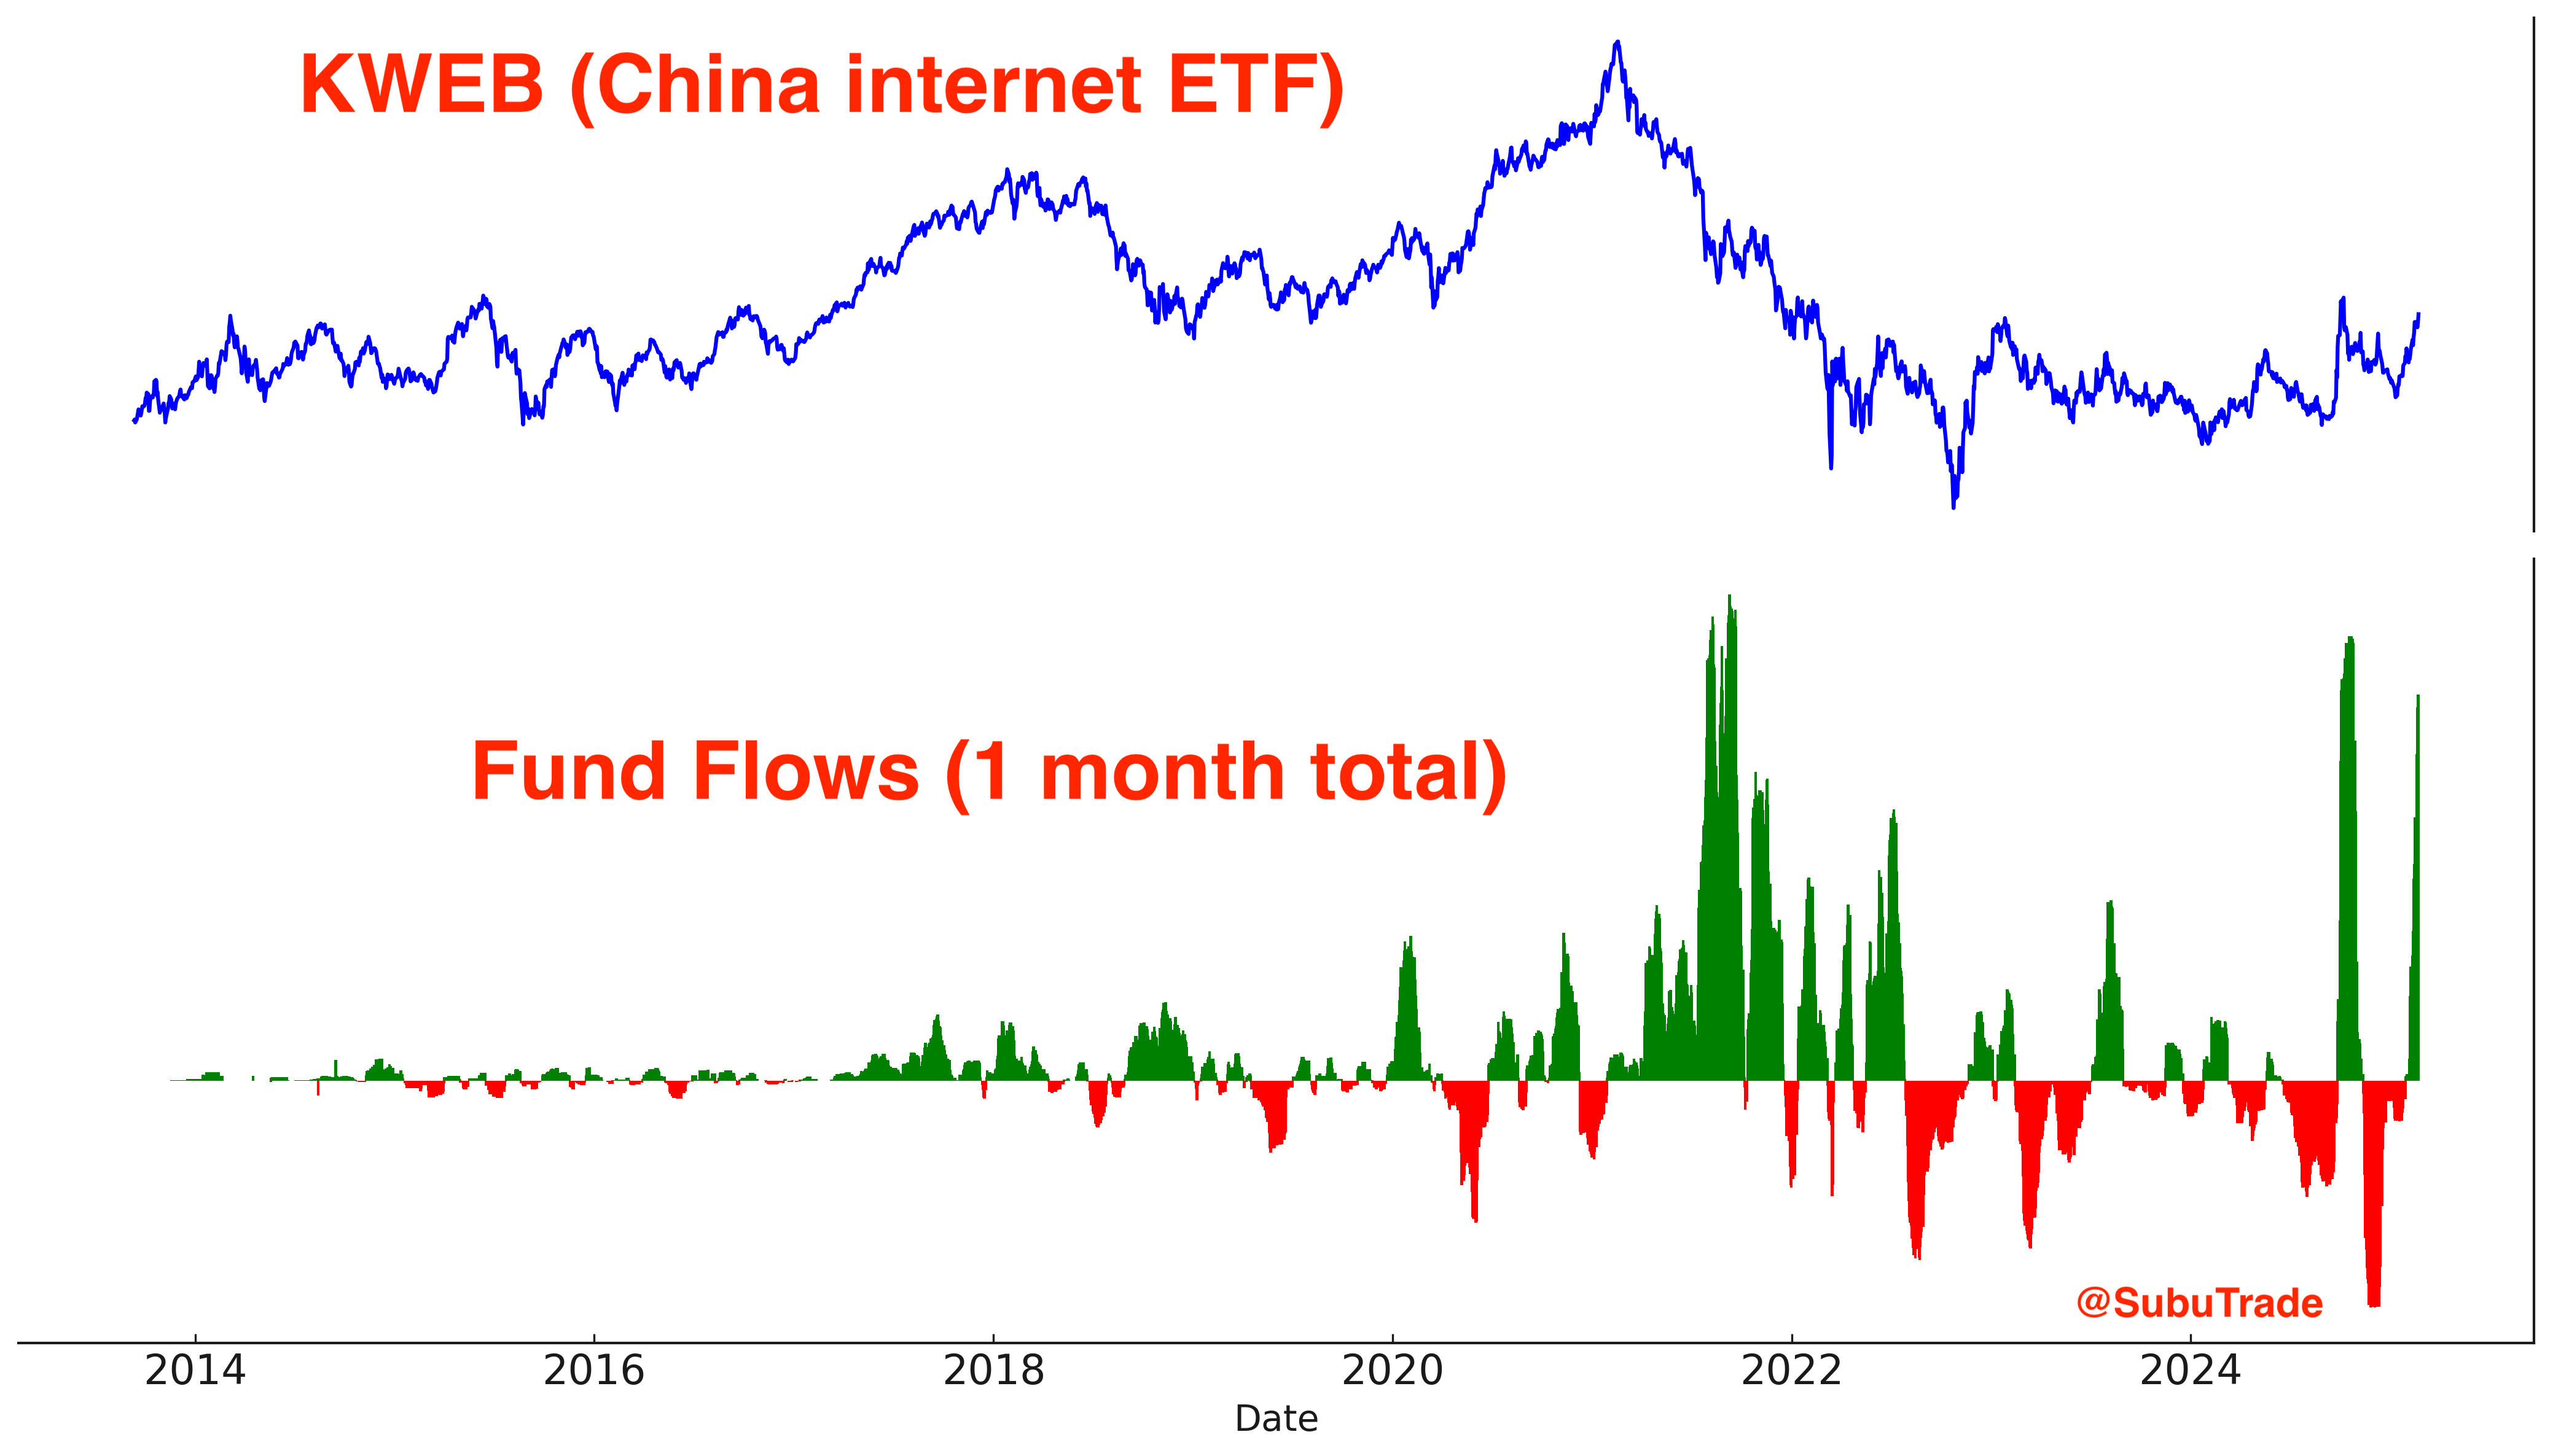
Fund Flow:
Over the past month, Chinese tech and internet stocks have seen significant inflows, with investors rushing into previously out-of-favor names such as Alibaba.
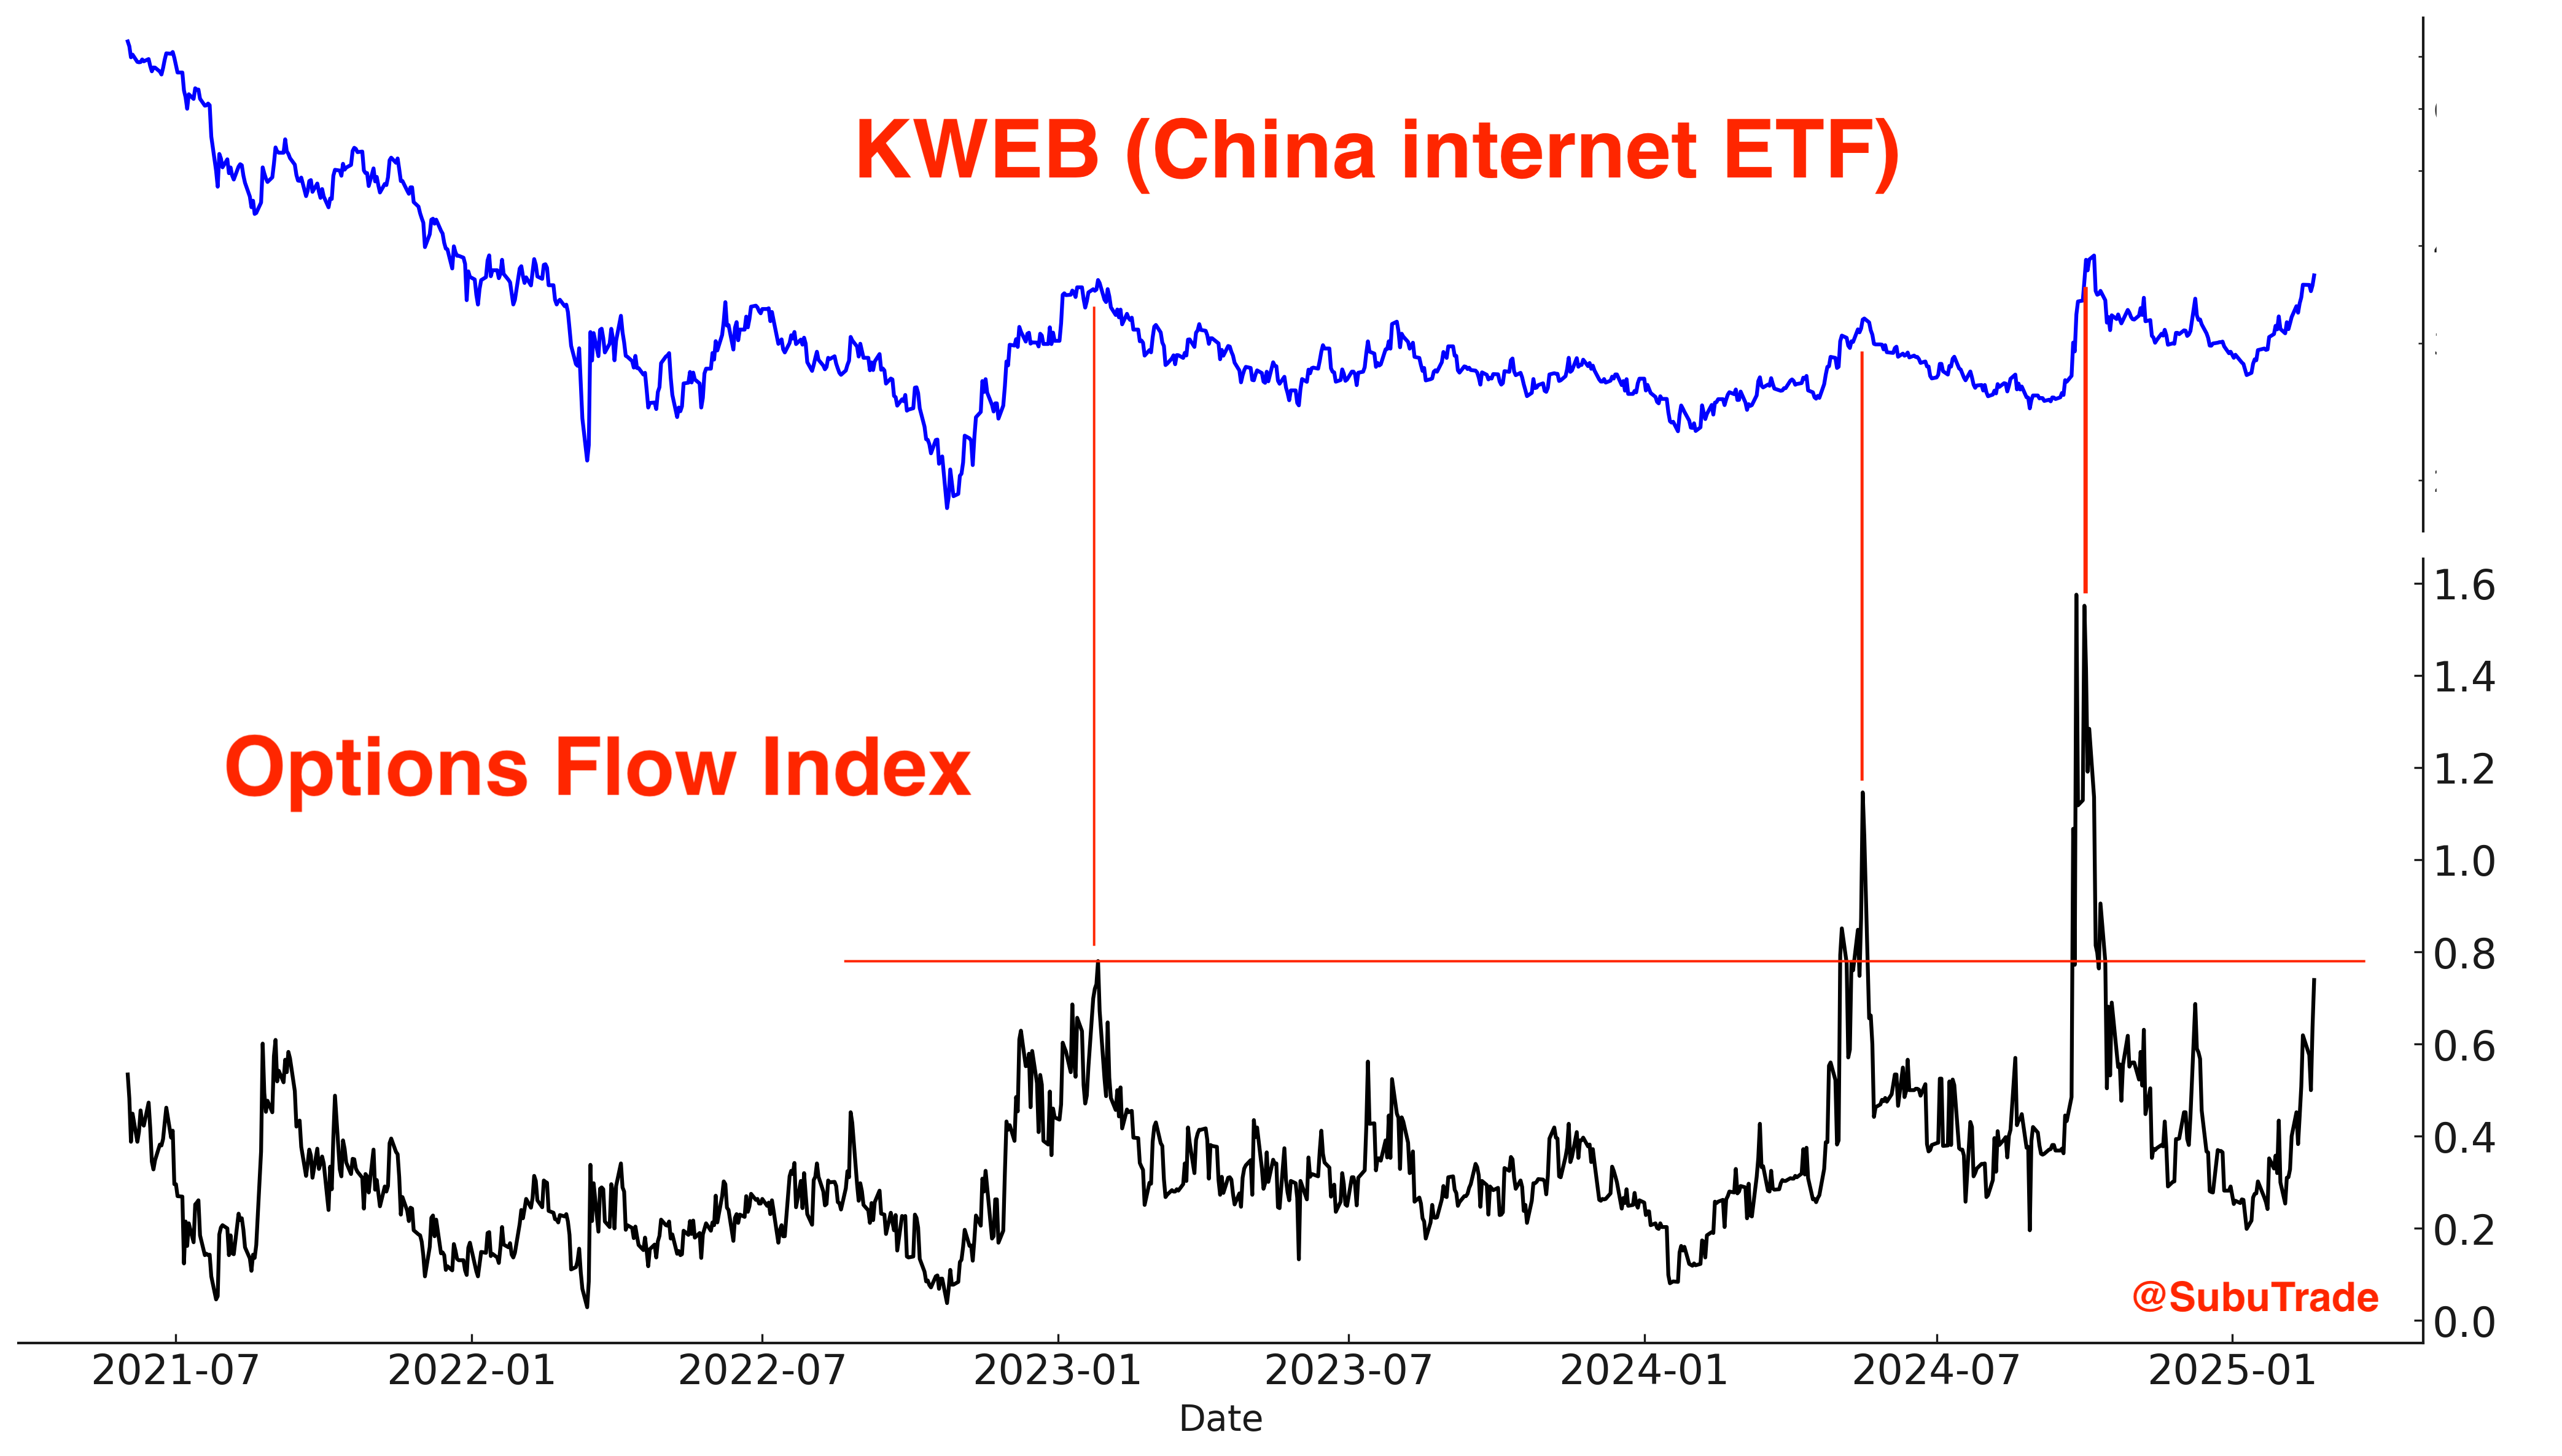
As a result, KWEB’s Options Flow Index is ramping higher.
Chinese equities are trending higher:
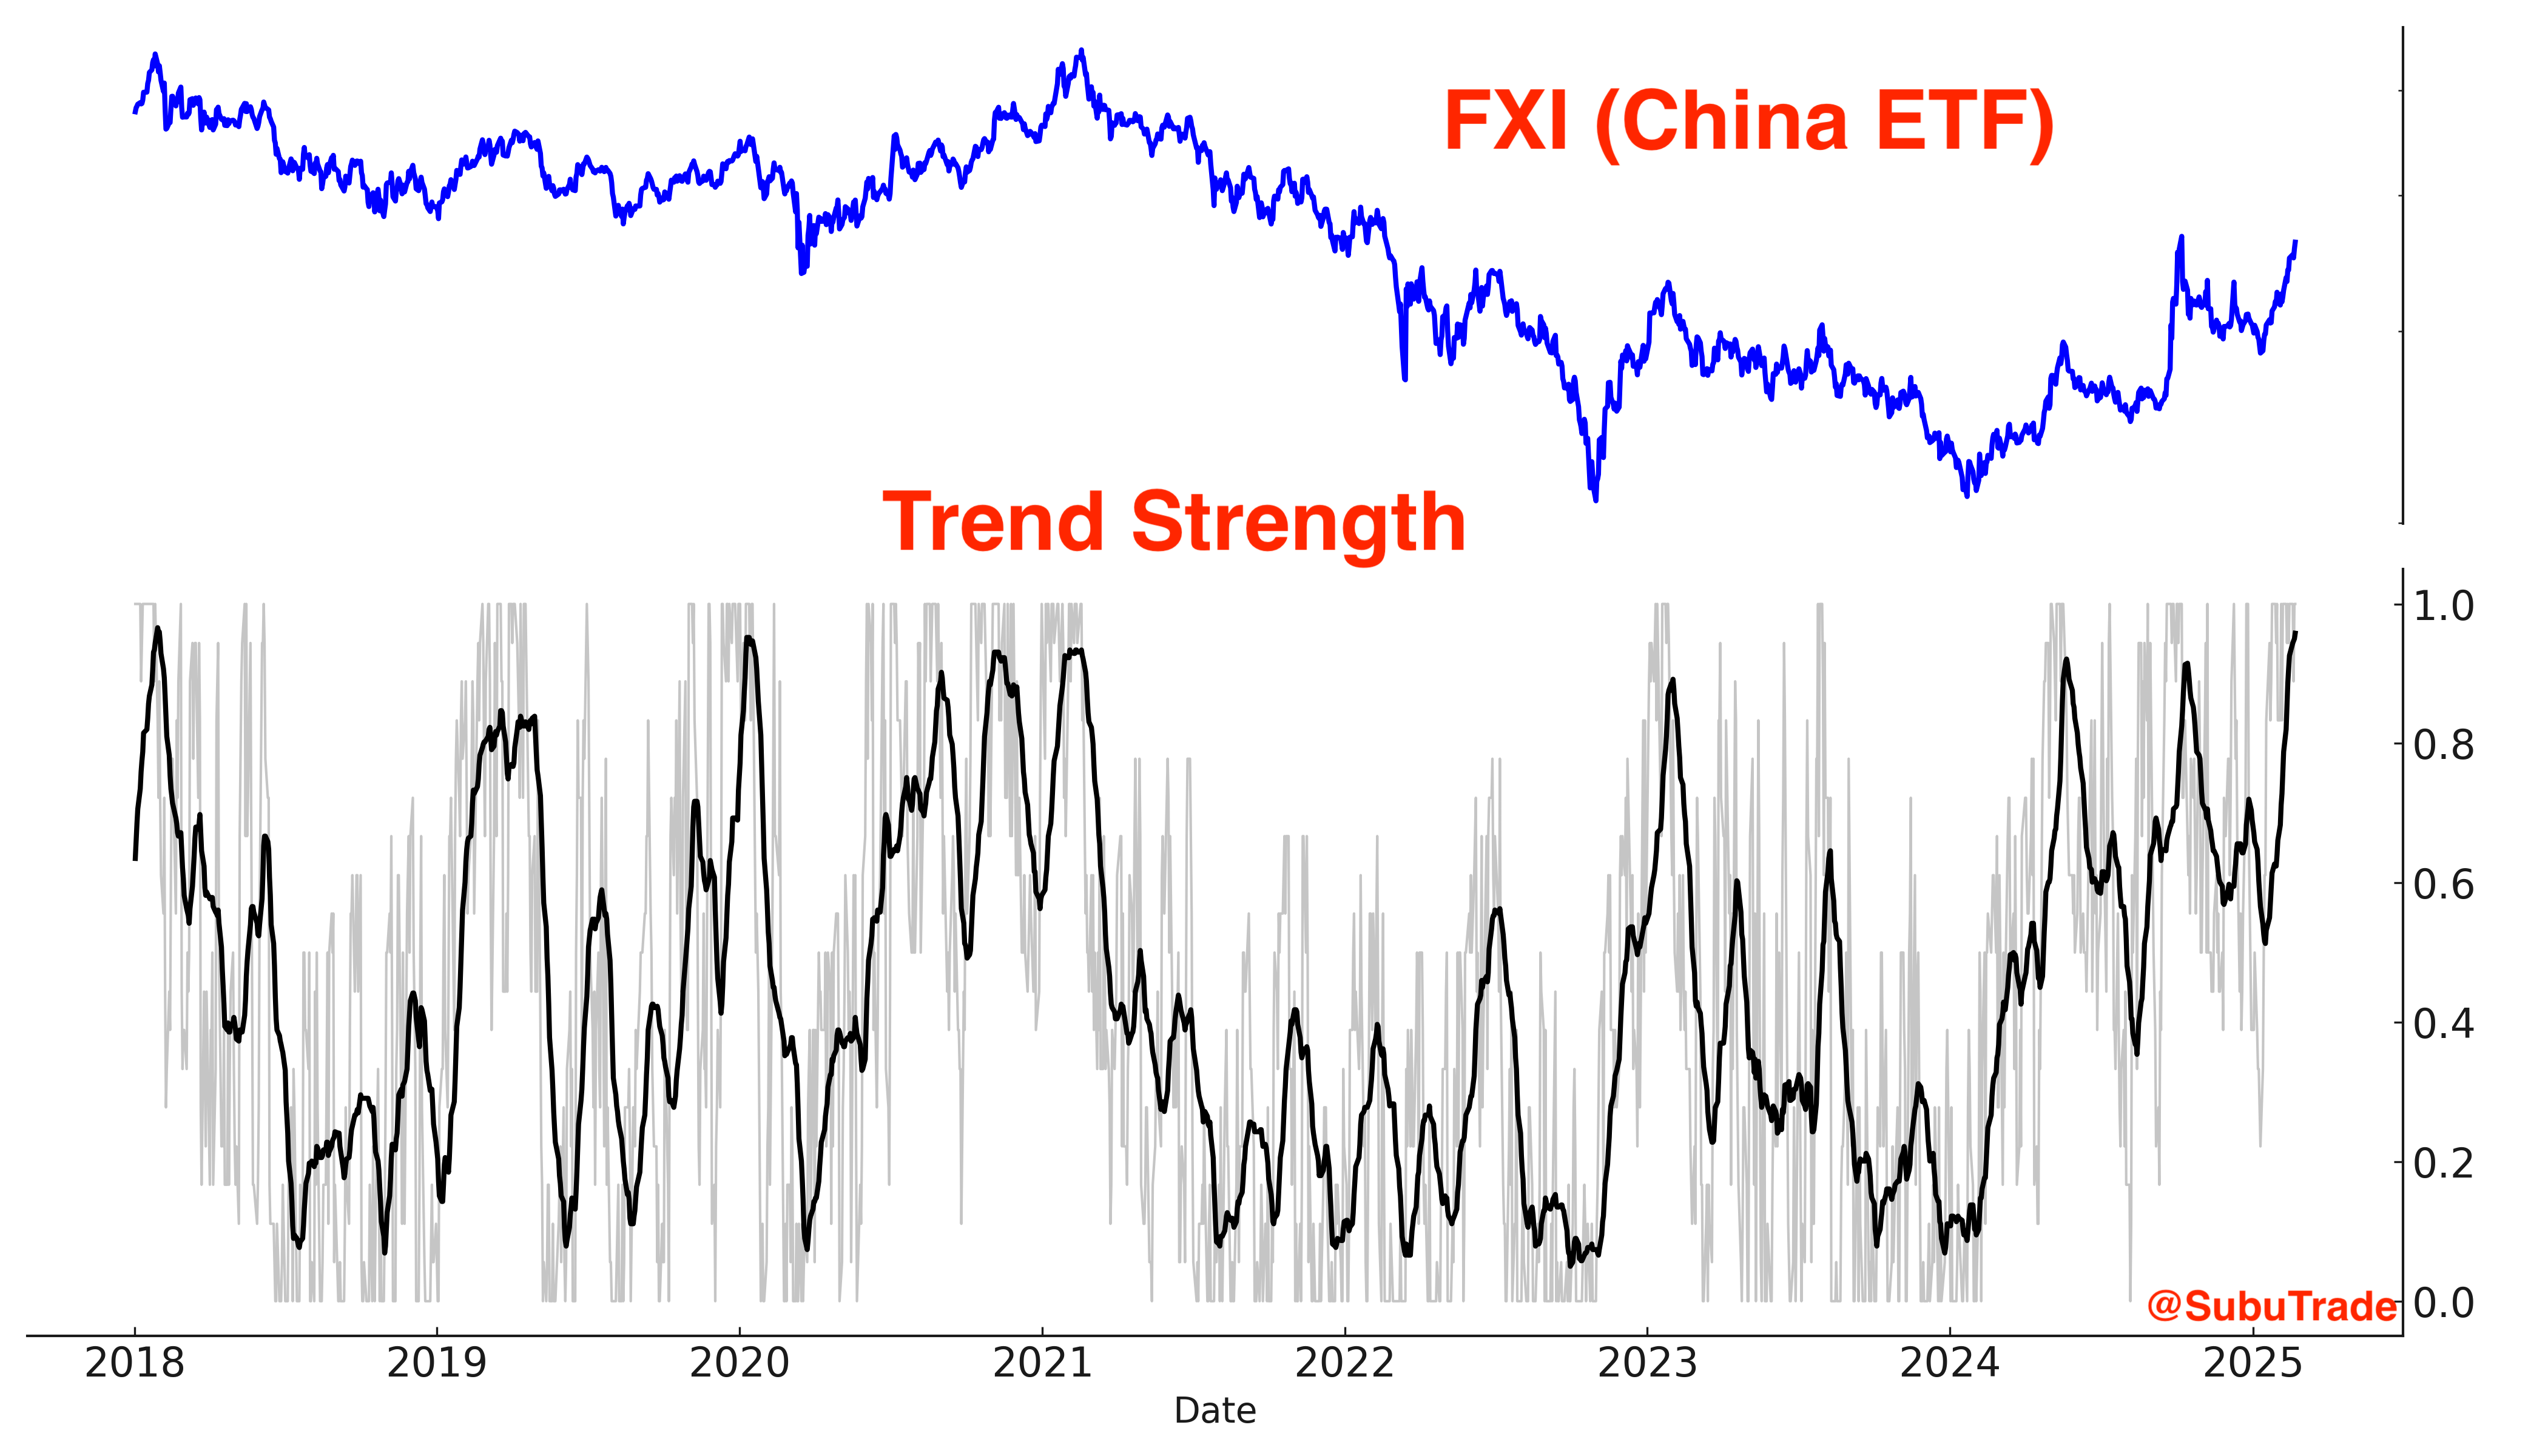
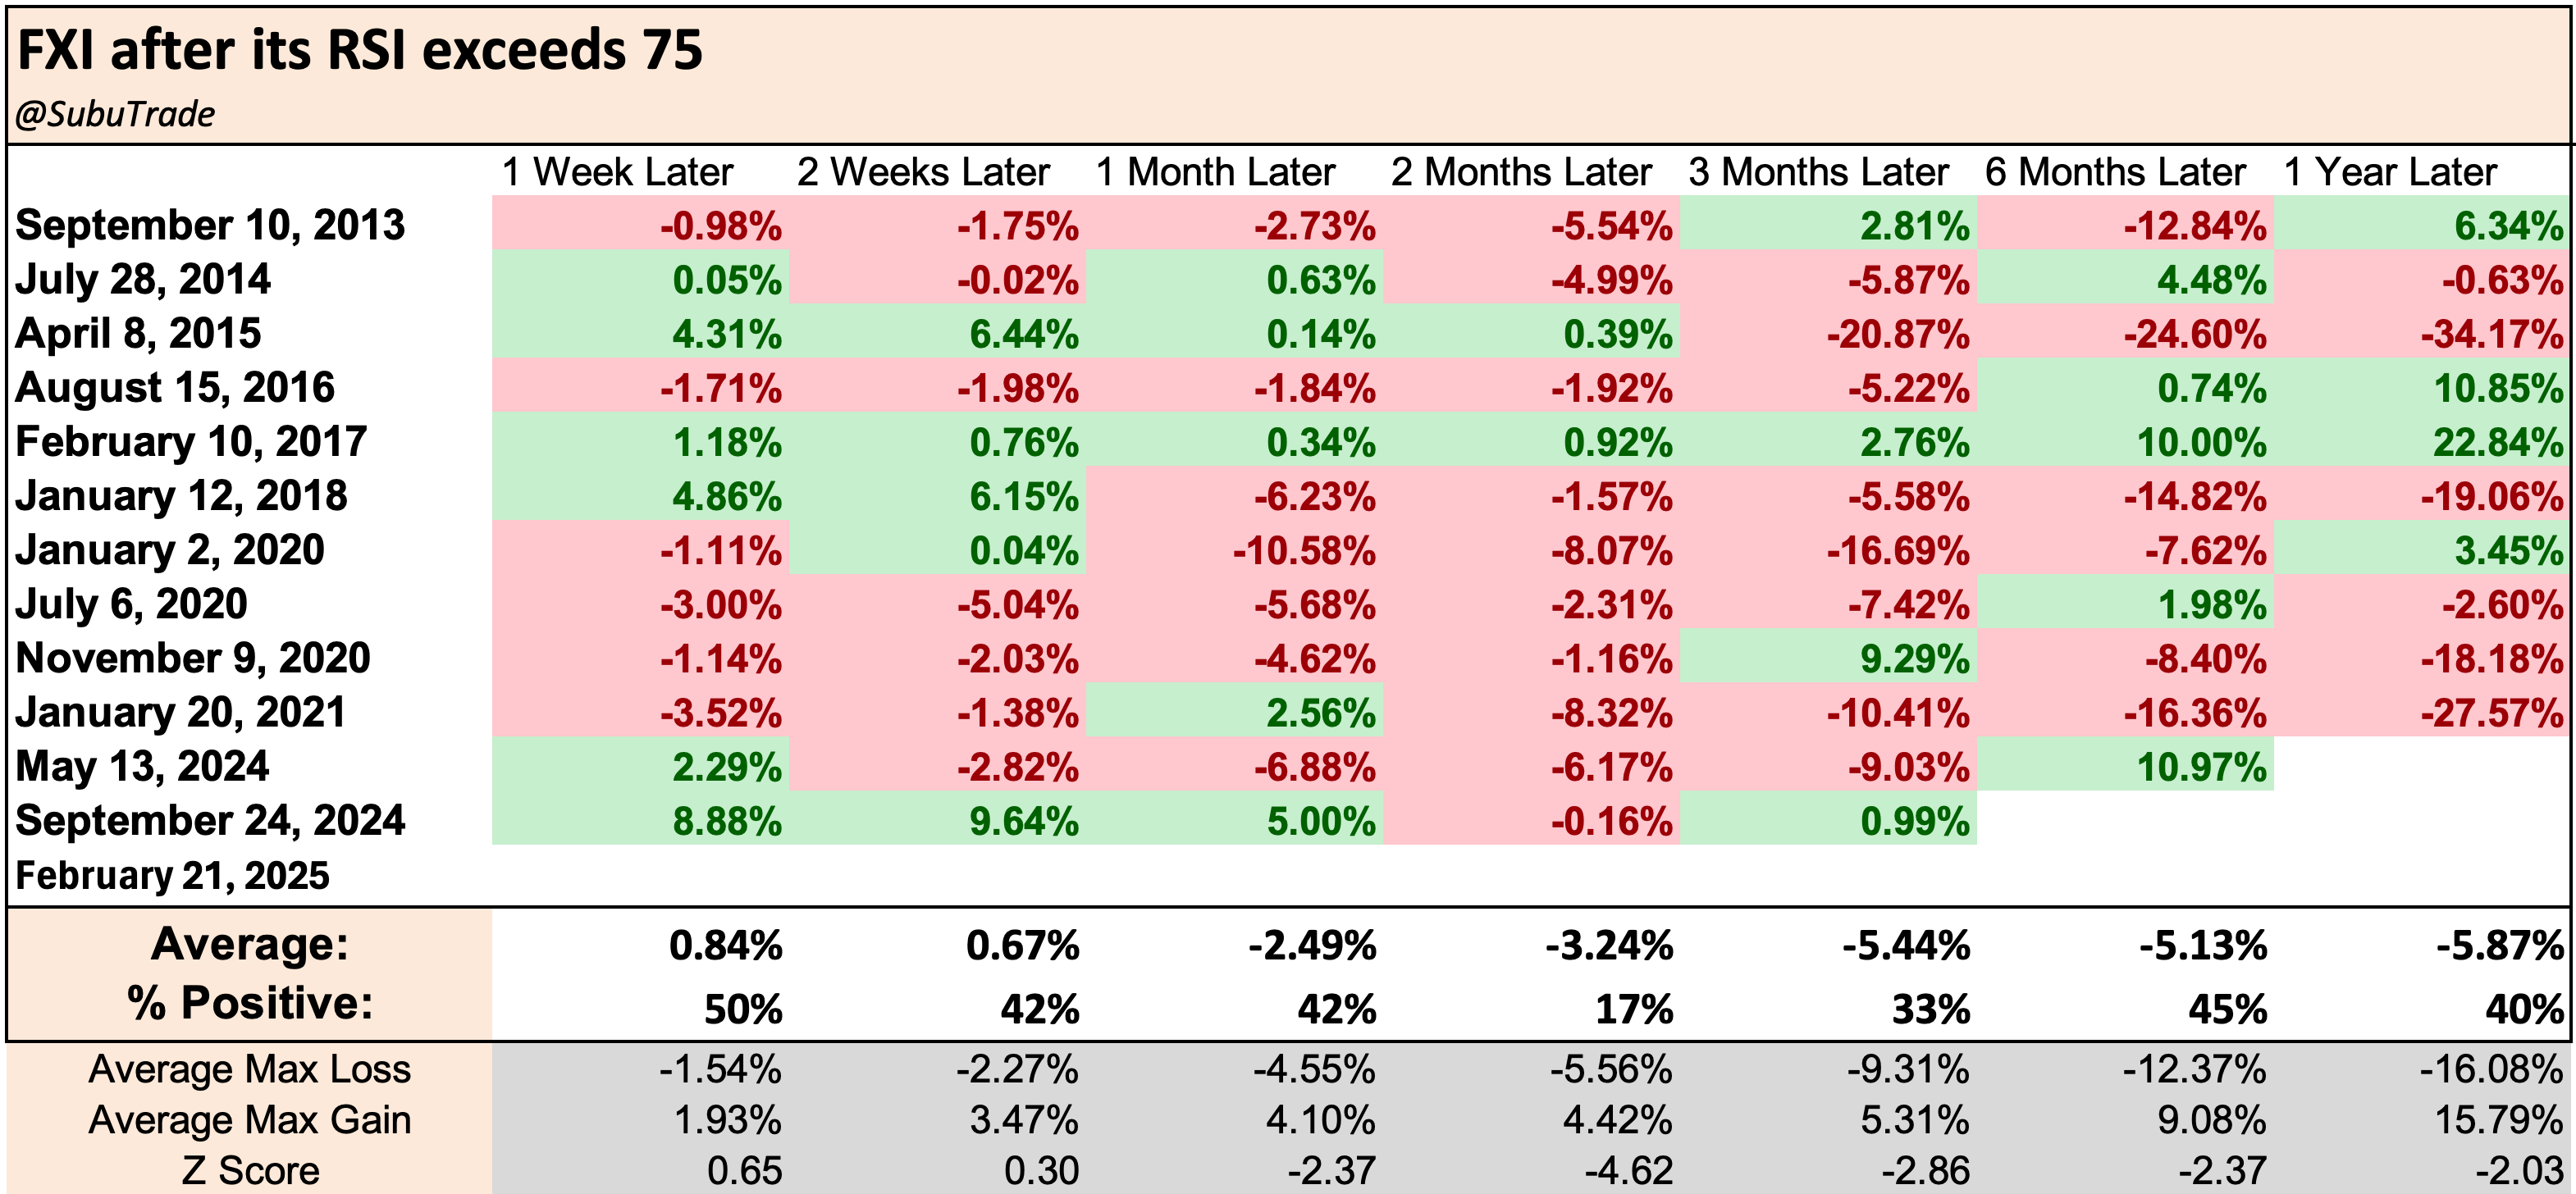
One could argue that the trend is too strong. China’s 14 day RSI is elevated:
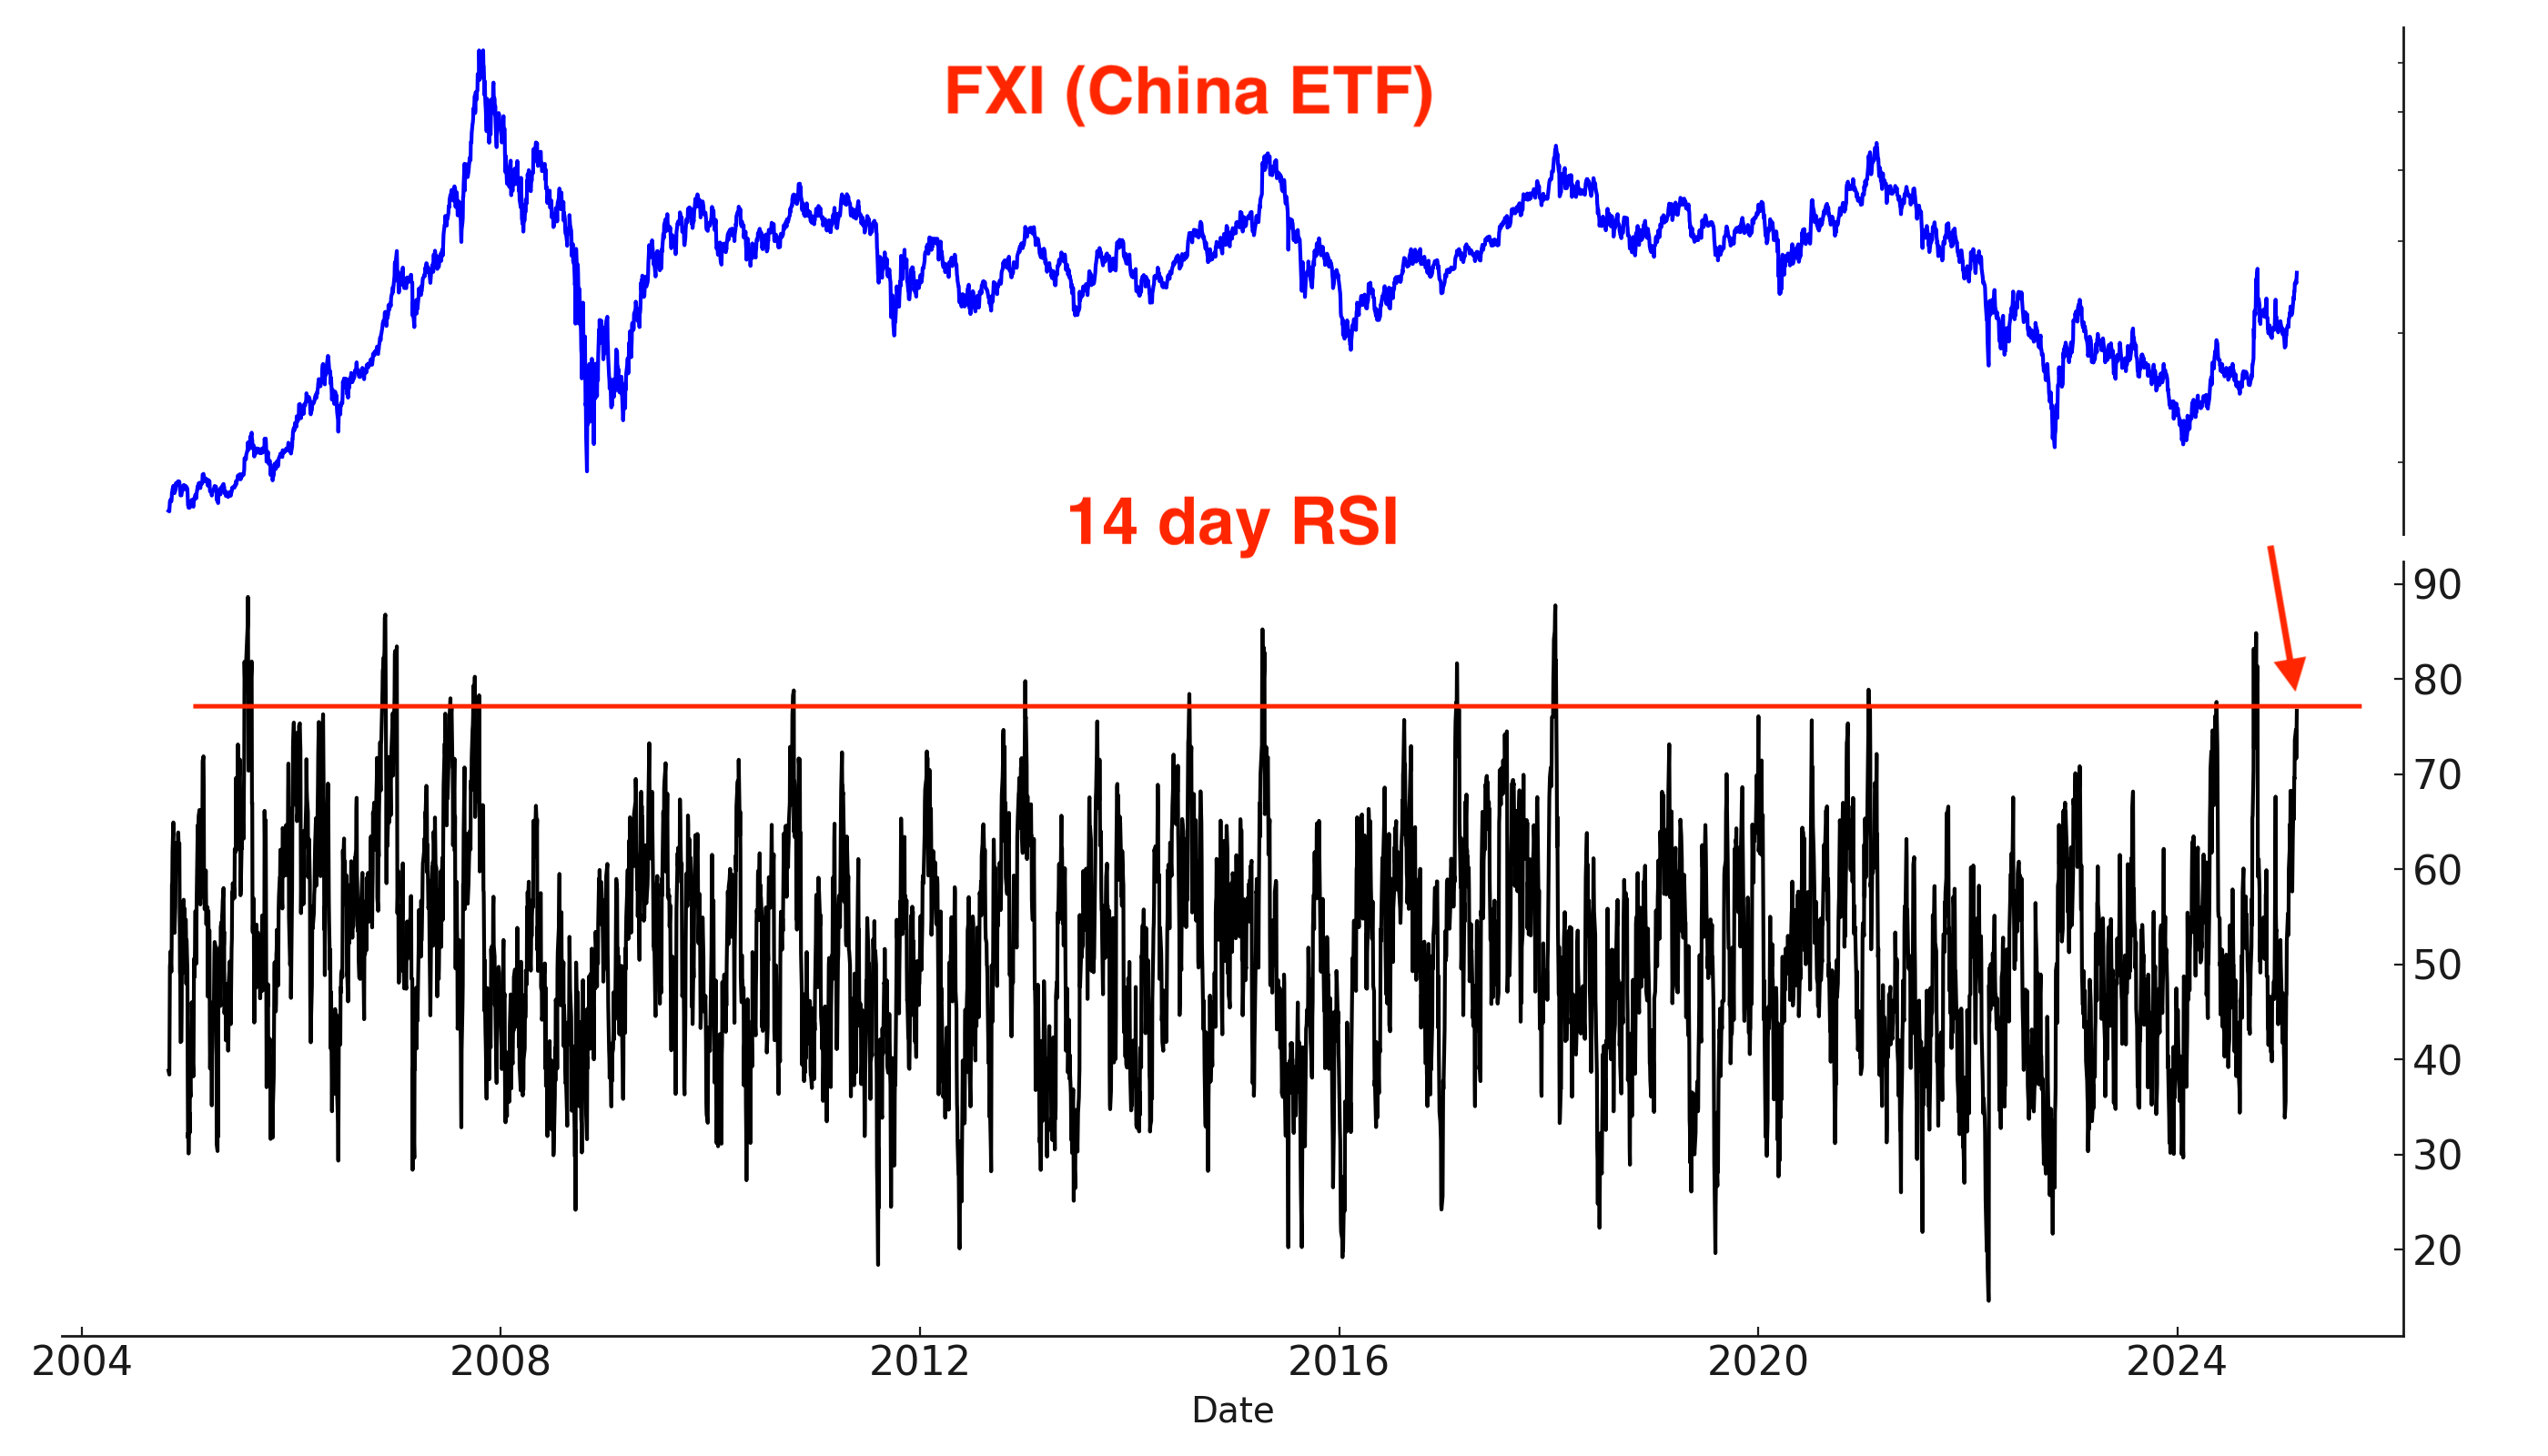
Historically, this was a bearish sign for Chinese equities over the next 2 months.
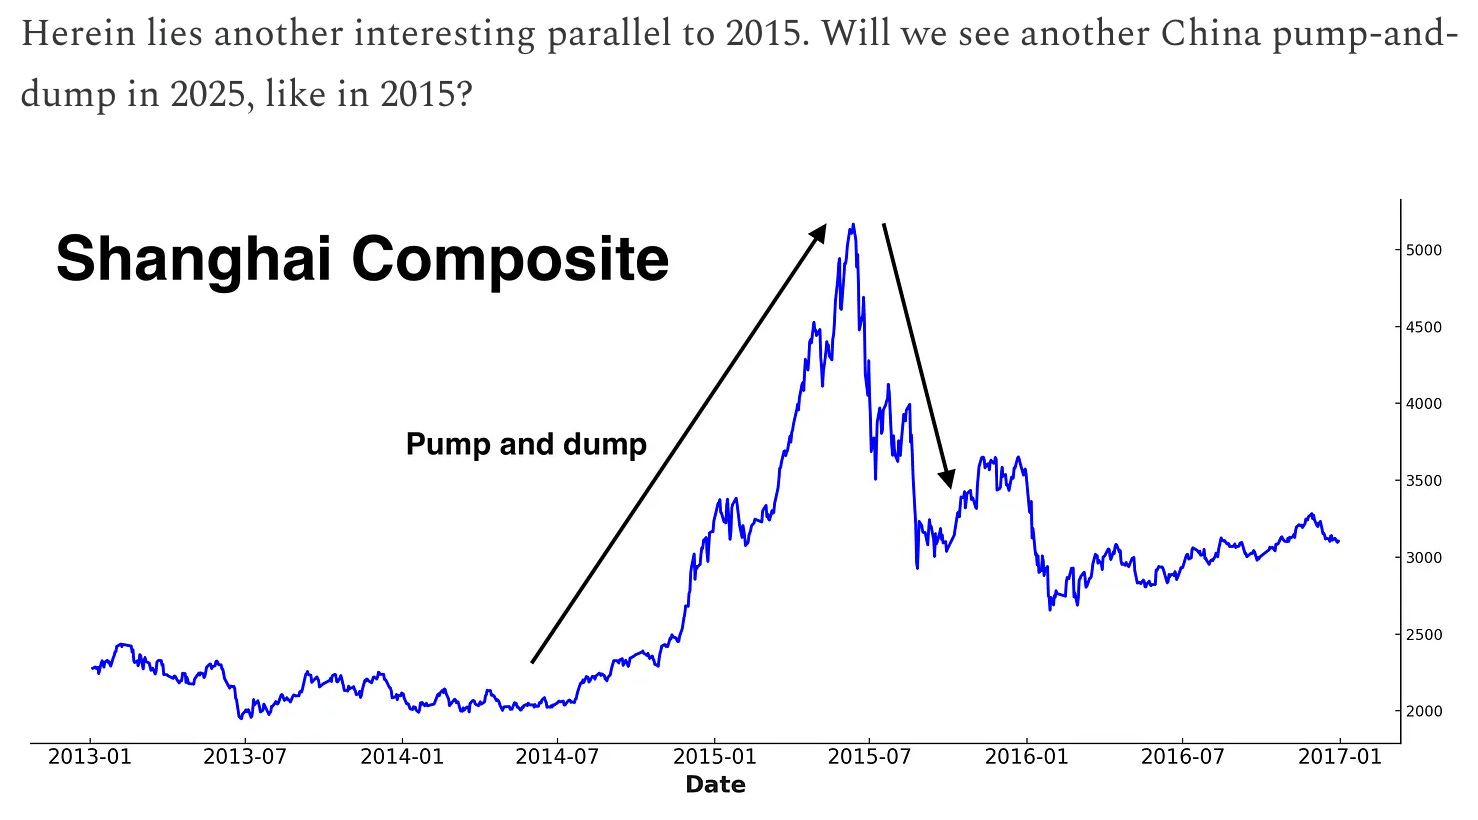
My base case is that Chinese equities may experience a consolidation or pullback before resuming their upward trend. Overall, I believe this rally will last a few months rather than evolve into a prolonged bull market. I expect a pattern similar to the speculative surges seen in the past, such as the 2015 rally.
As I wrote last month:
The rally in Chinese equities is drawing capital away from Indian equities as investors rebalance their emerging markets portfolios.
Indian Equities
I’ve been bullish on India in recent weeks - clearly I’ve been too early. While India remains the main beneficiary of the U.S.-China economic war, China's intermediate-term rally is diverting capital away from Indian equities.
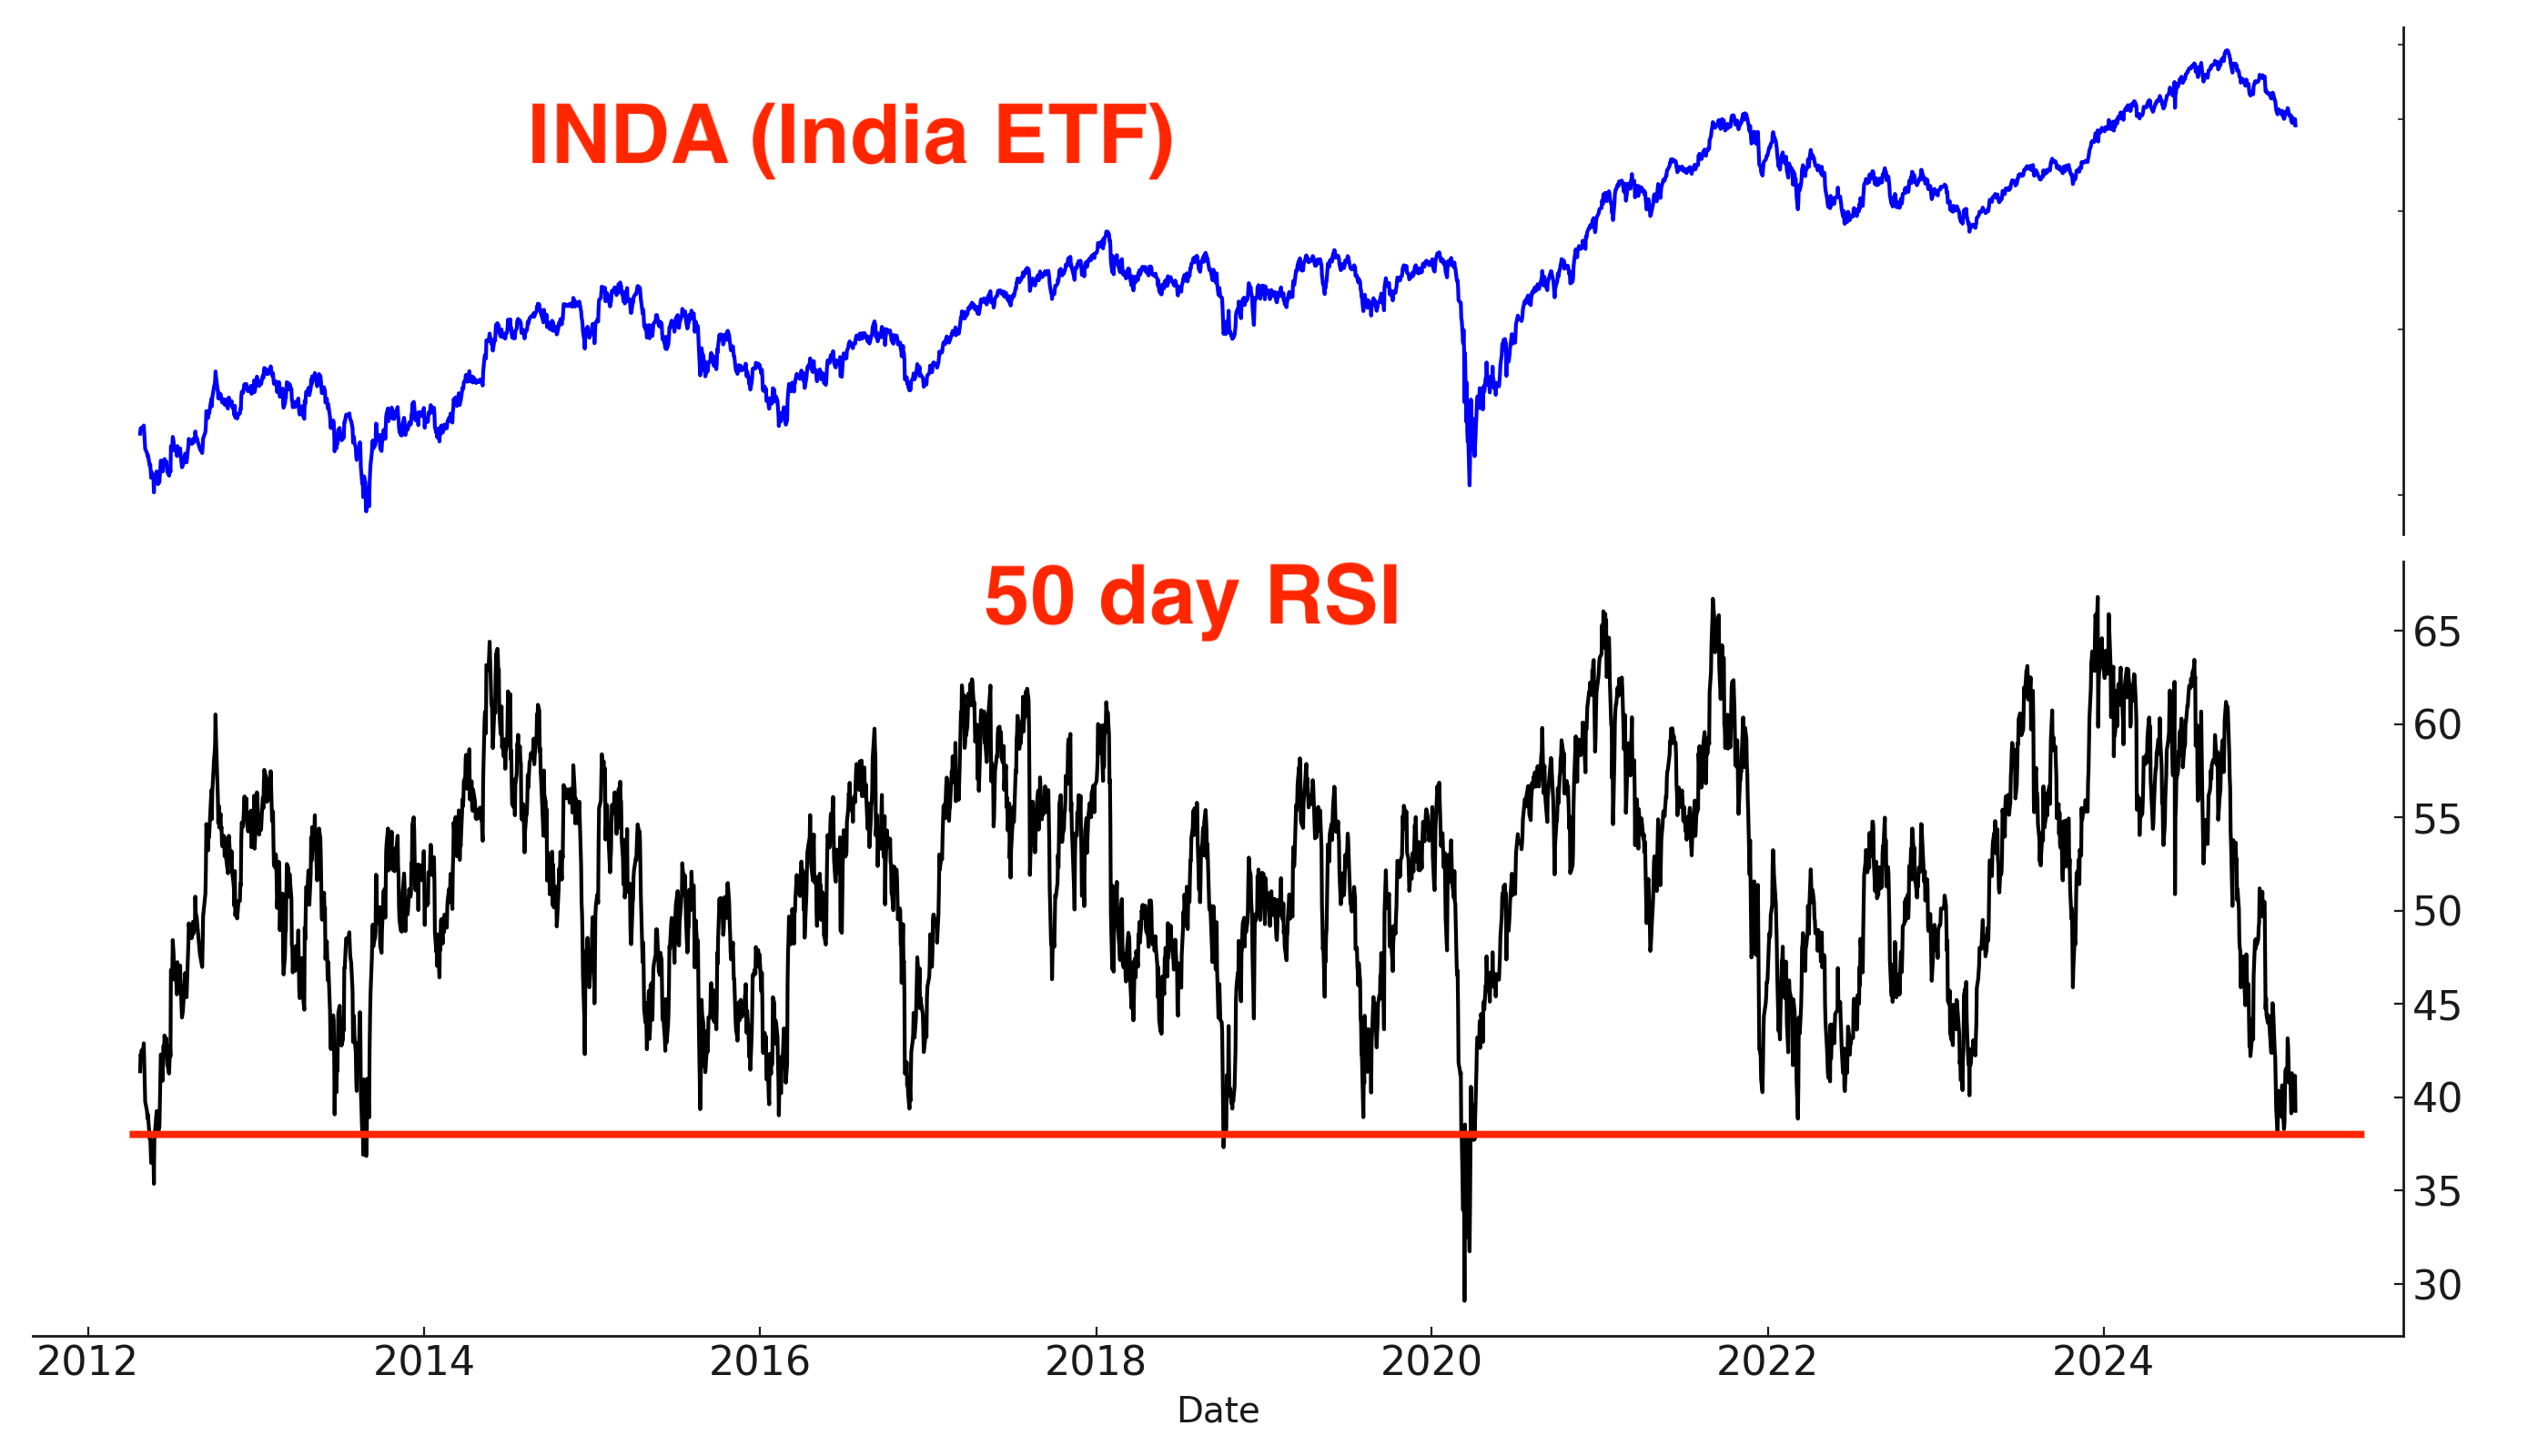
Indian equities remain in a Down trend:
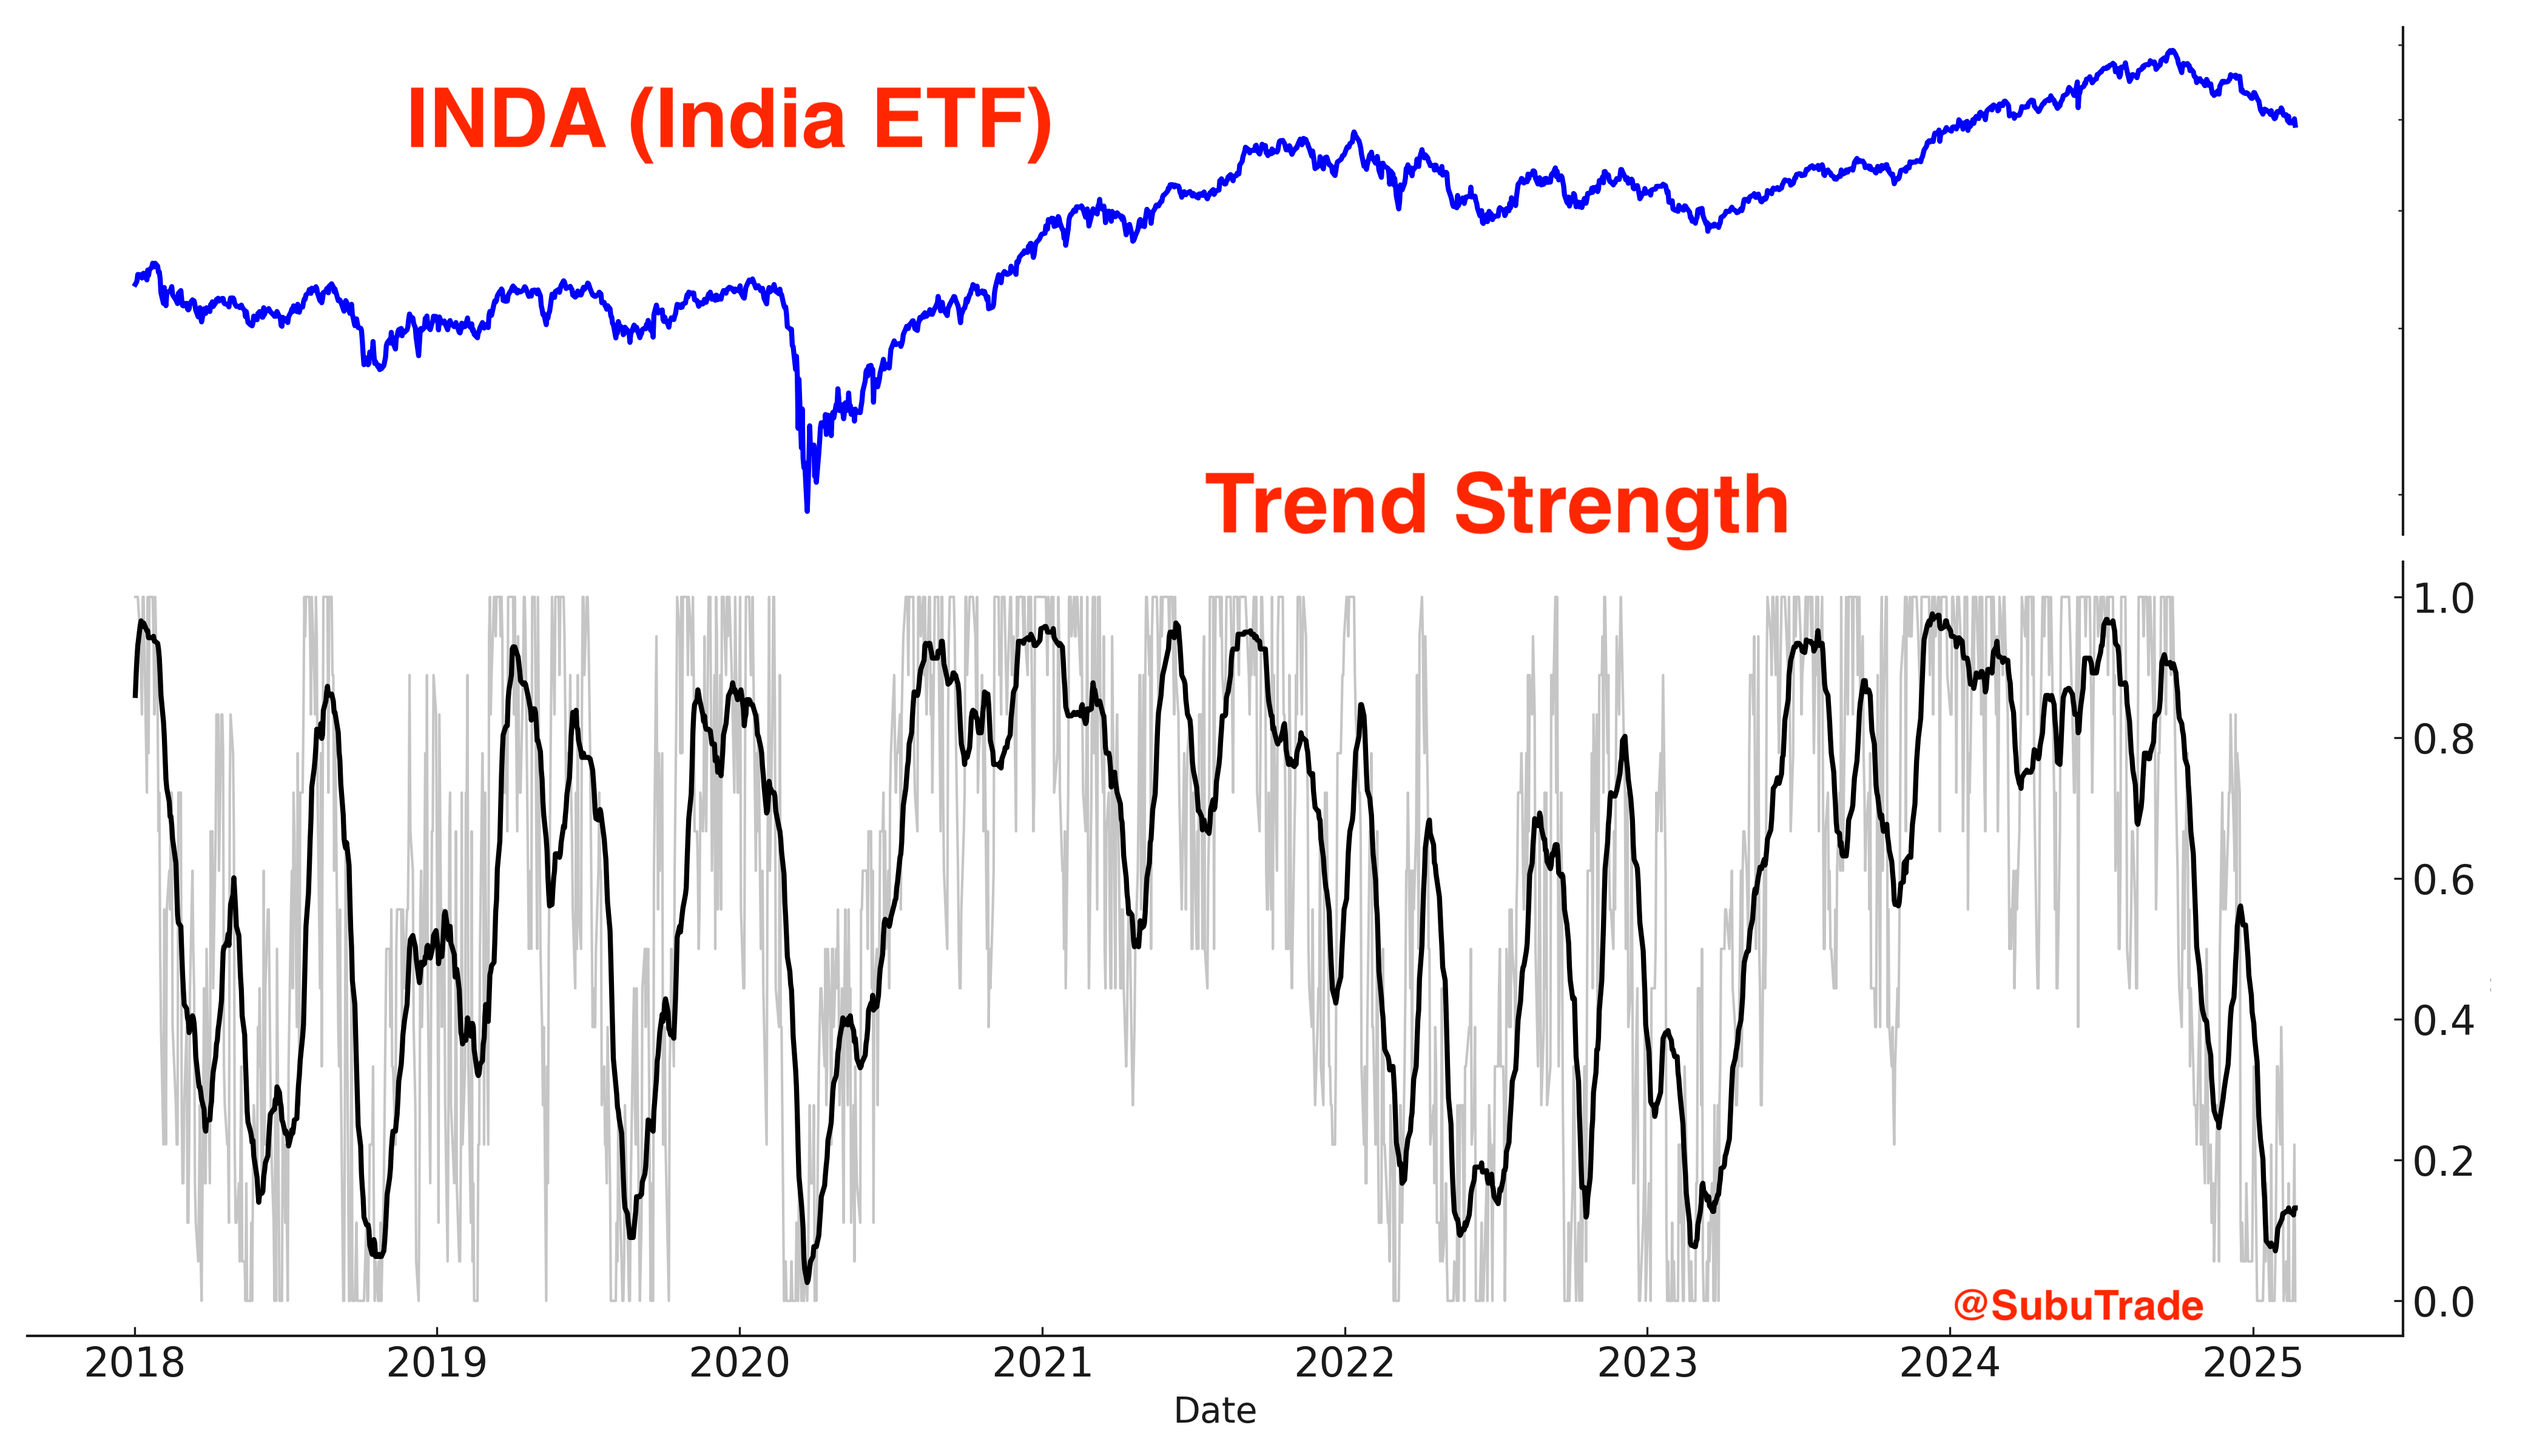
However, India is quite oversold, limiting further downside from this point:
I remain bullish on India.
Gold and silver
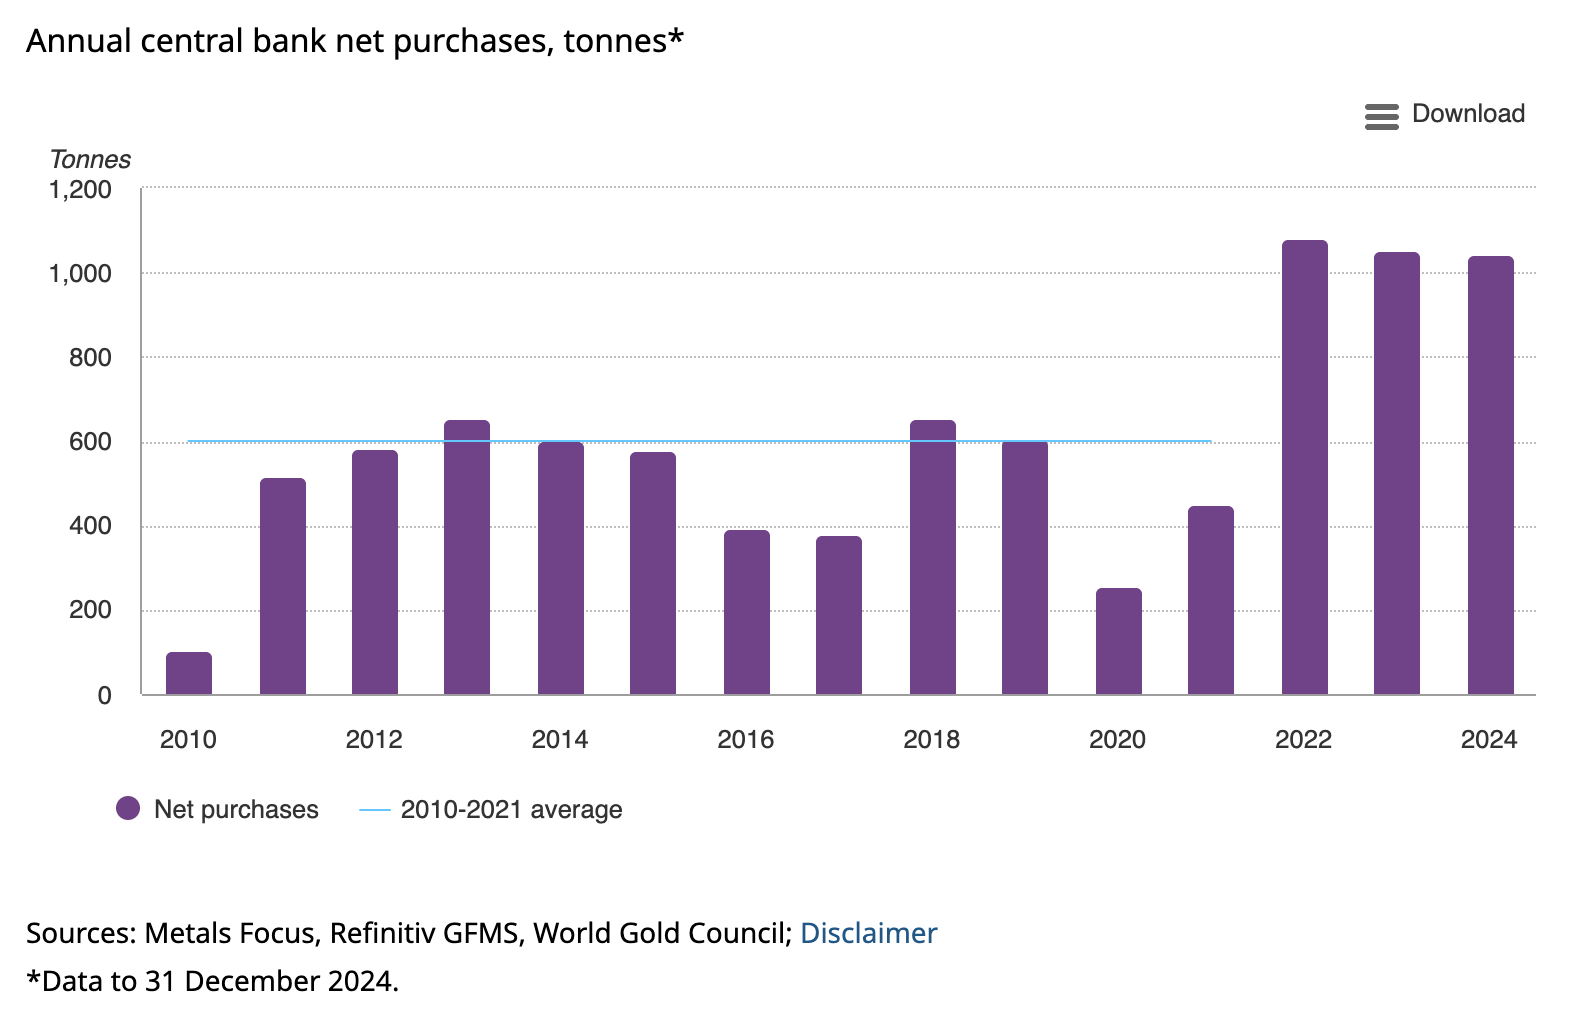
The bullish narrative/theme for gold’s rally is simple: global central banks are buying gold because they fear holding U.S. Treasuries that could be confiscated in the middle of a geo-political conflict (e.g. U.S.-China economic war):
Gold has rallied 8 weeks in a row:
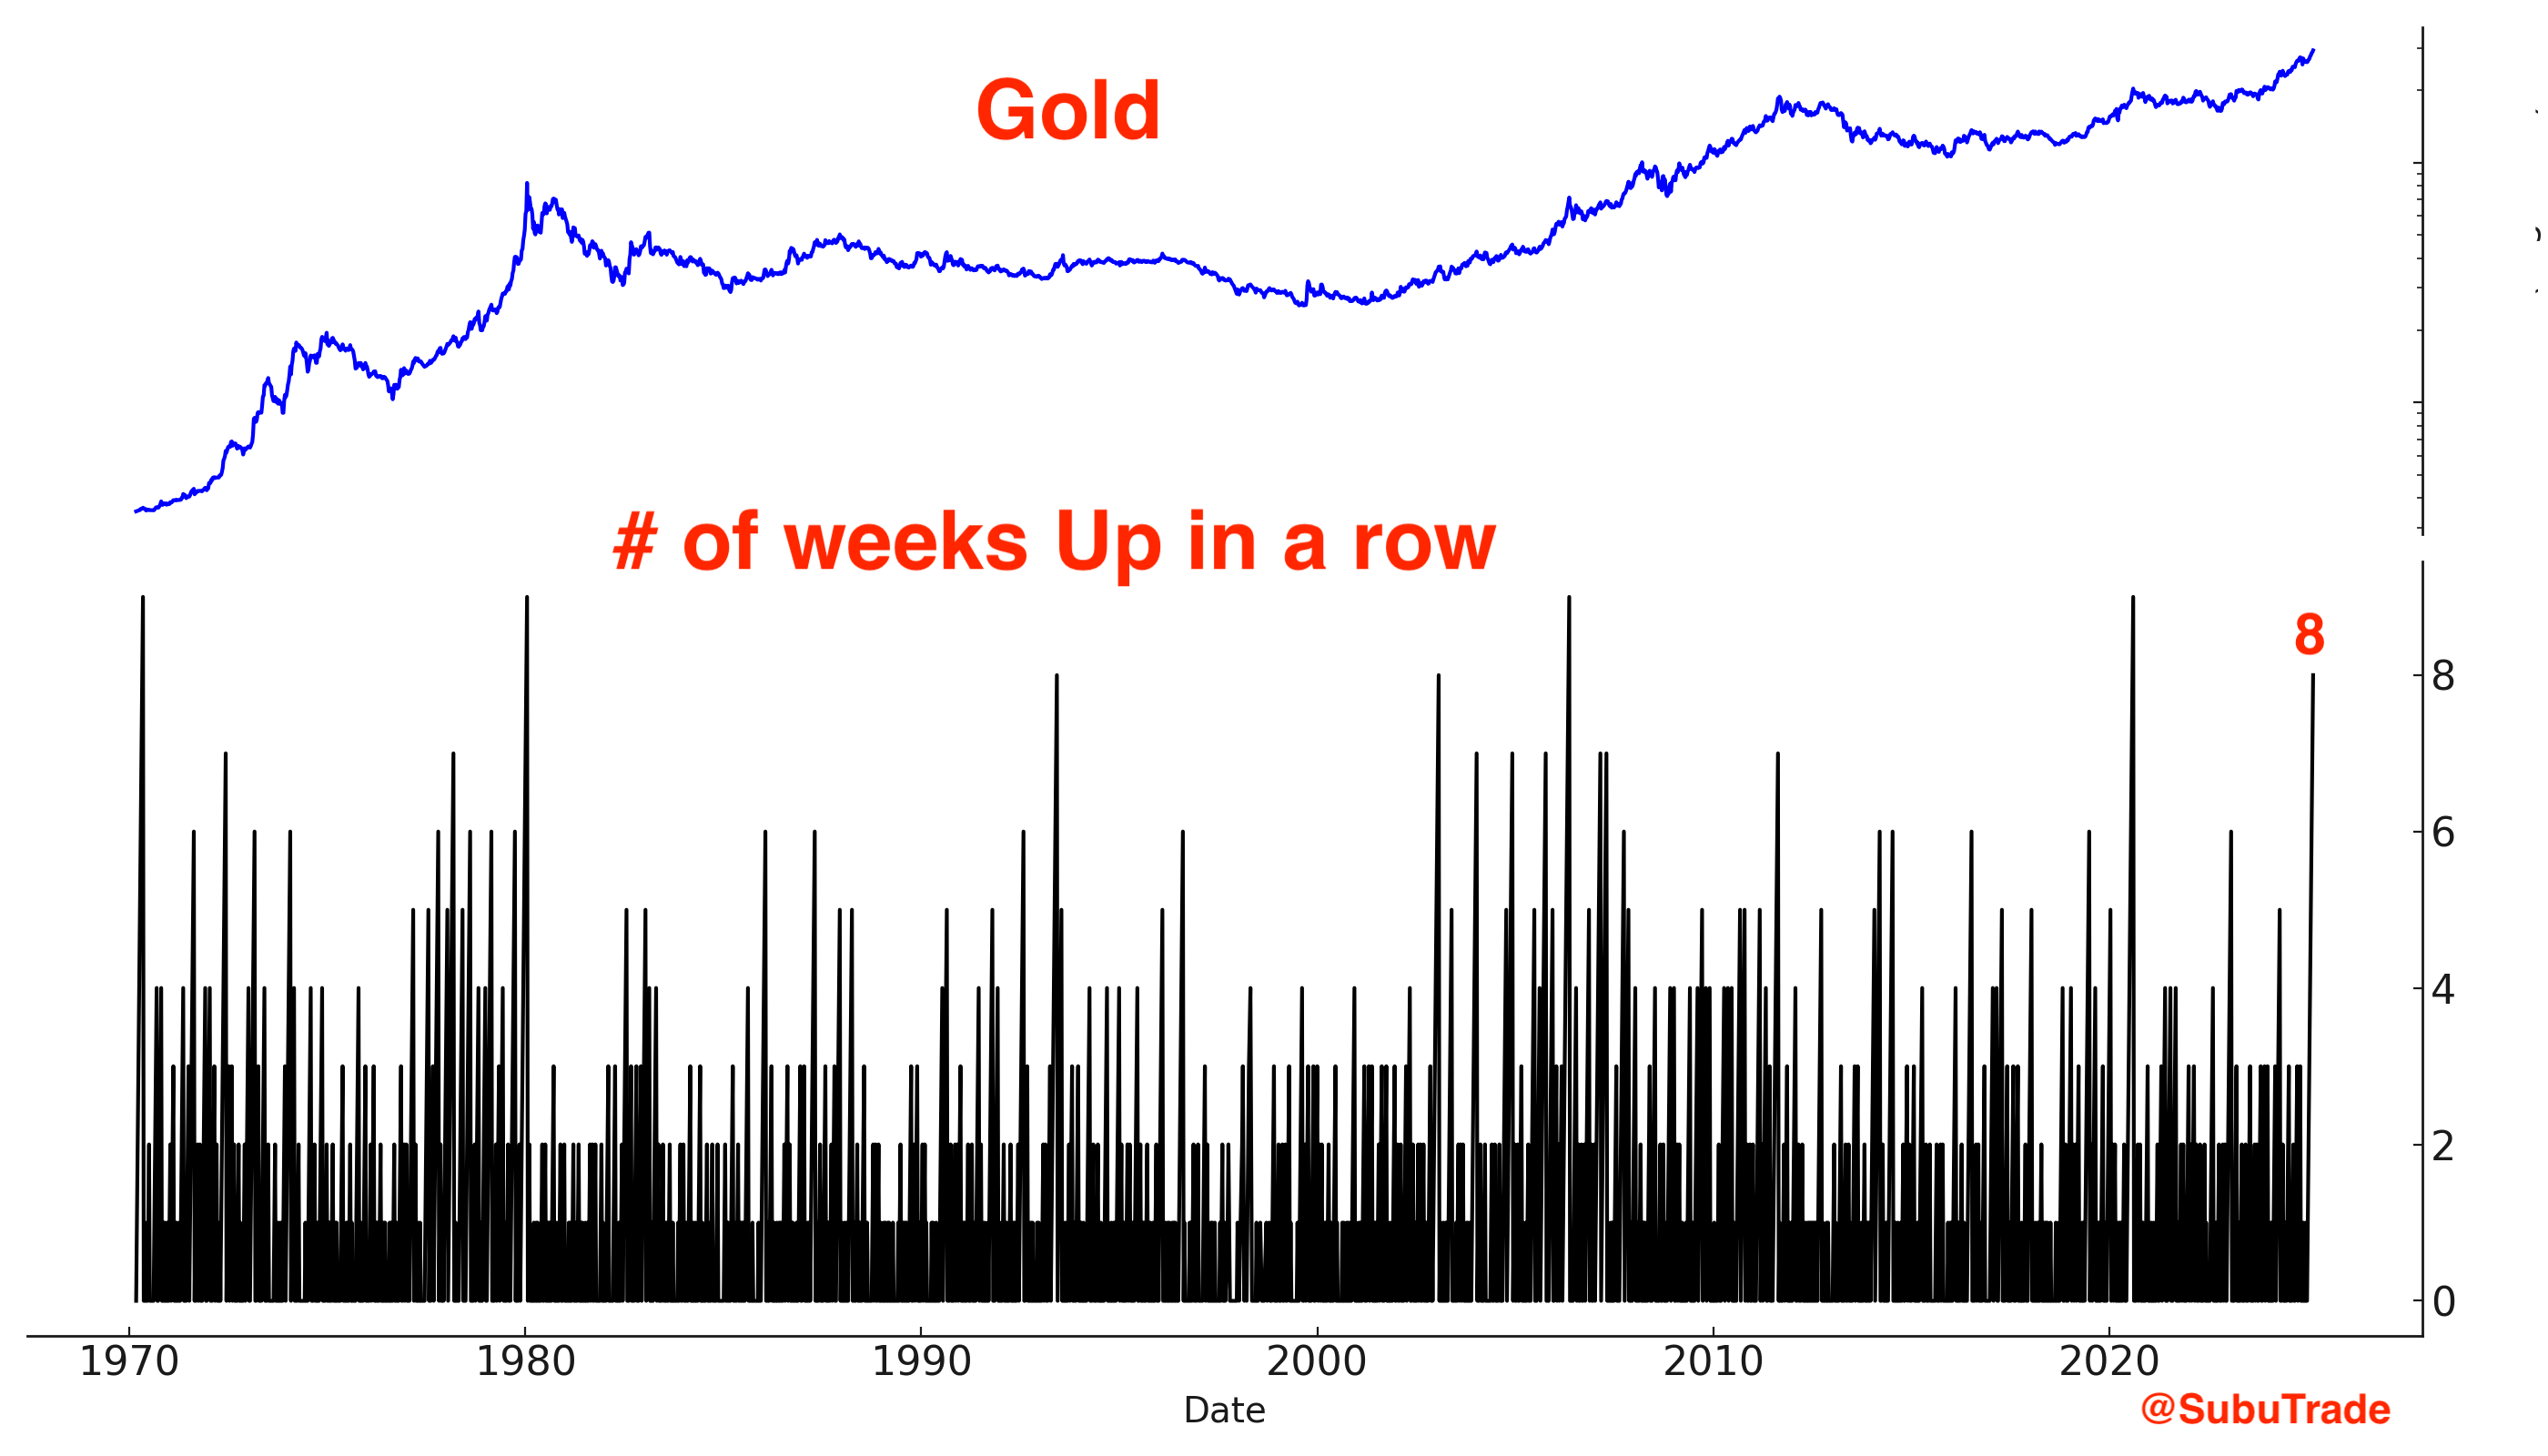
When this happened in the past, gold was lower every single time 3 months later.

As someone who is long precious metals right now, the main question is how much higher can gold go before it tops.
Could we see a short term pullback/consolidation, followed by another leg higher before an intermediate term top?
Gold remains in an Up trend:
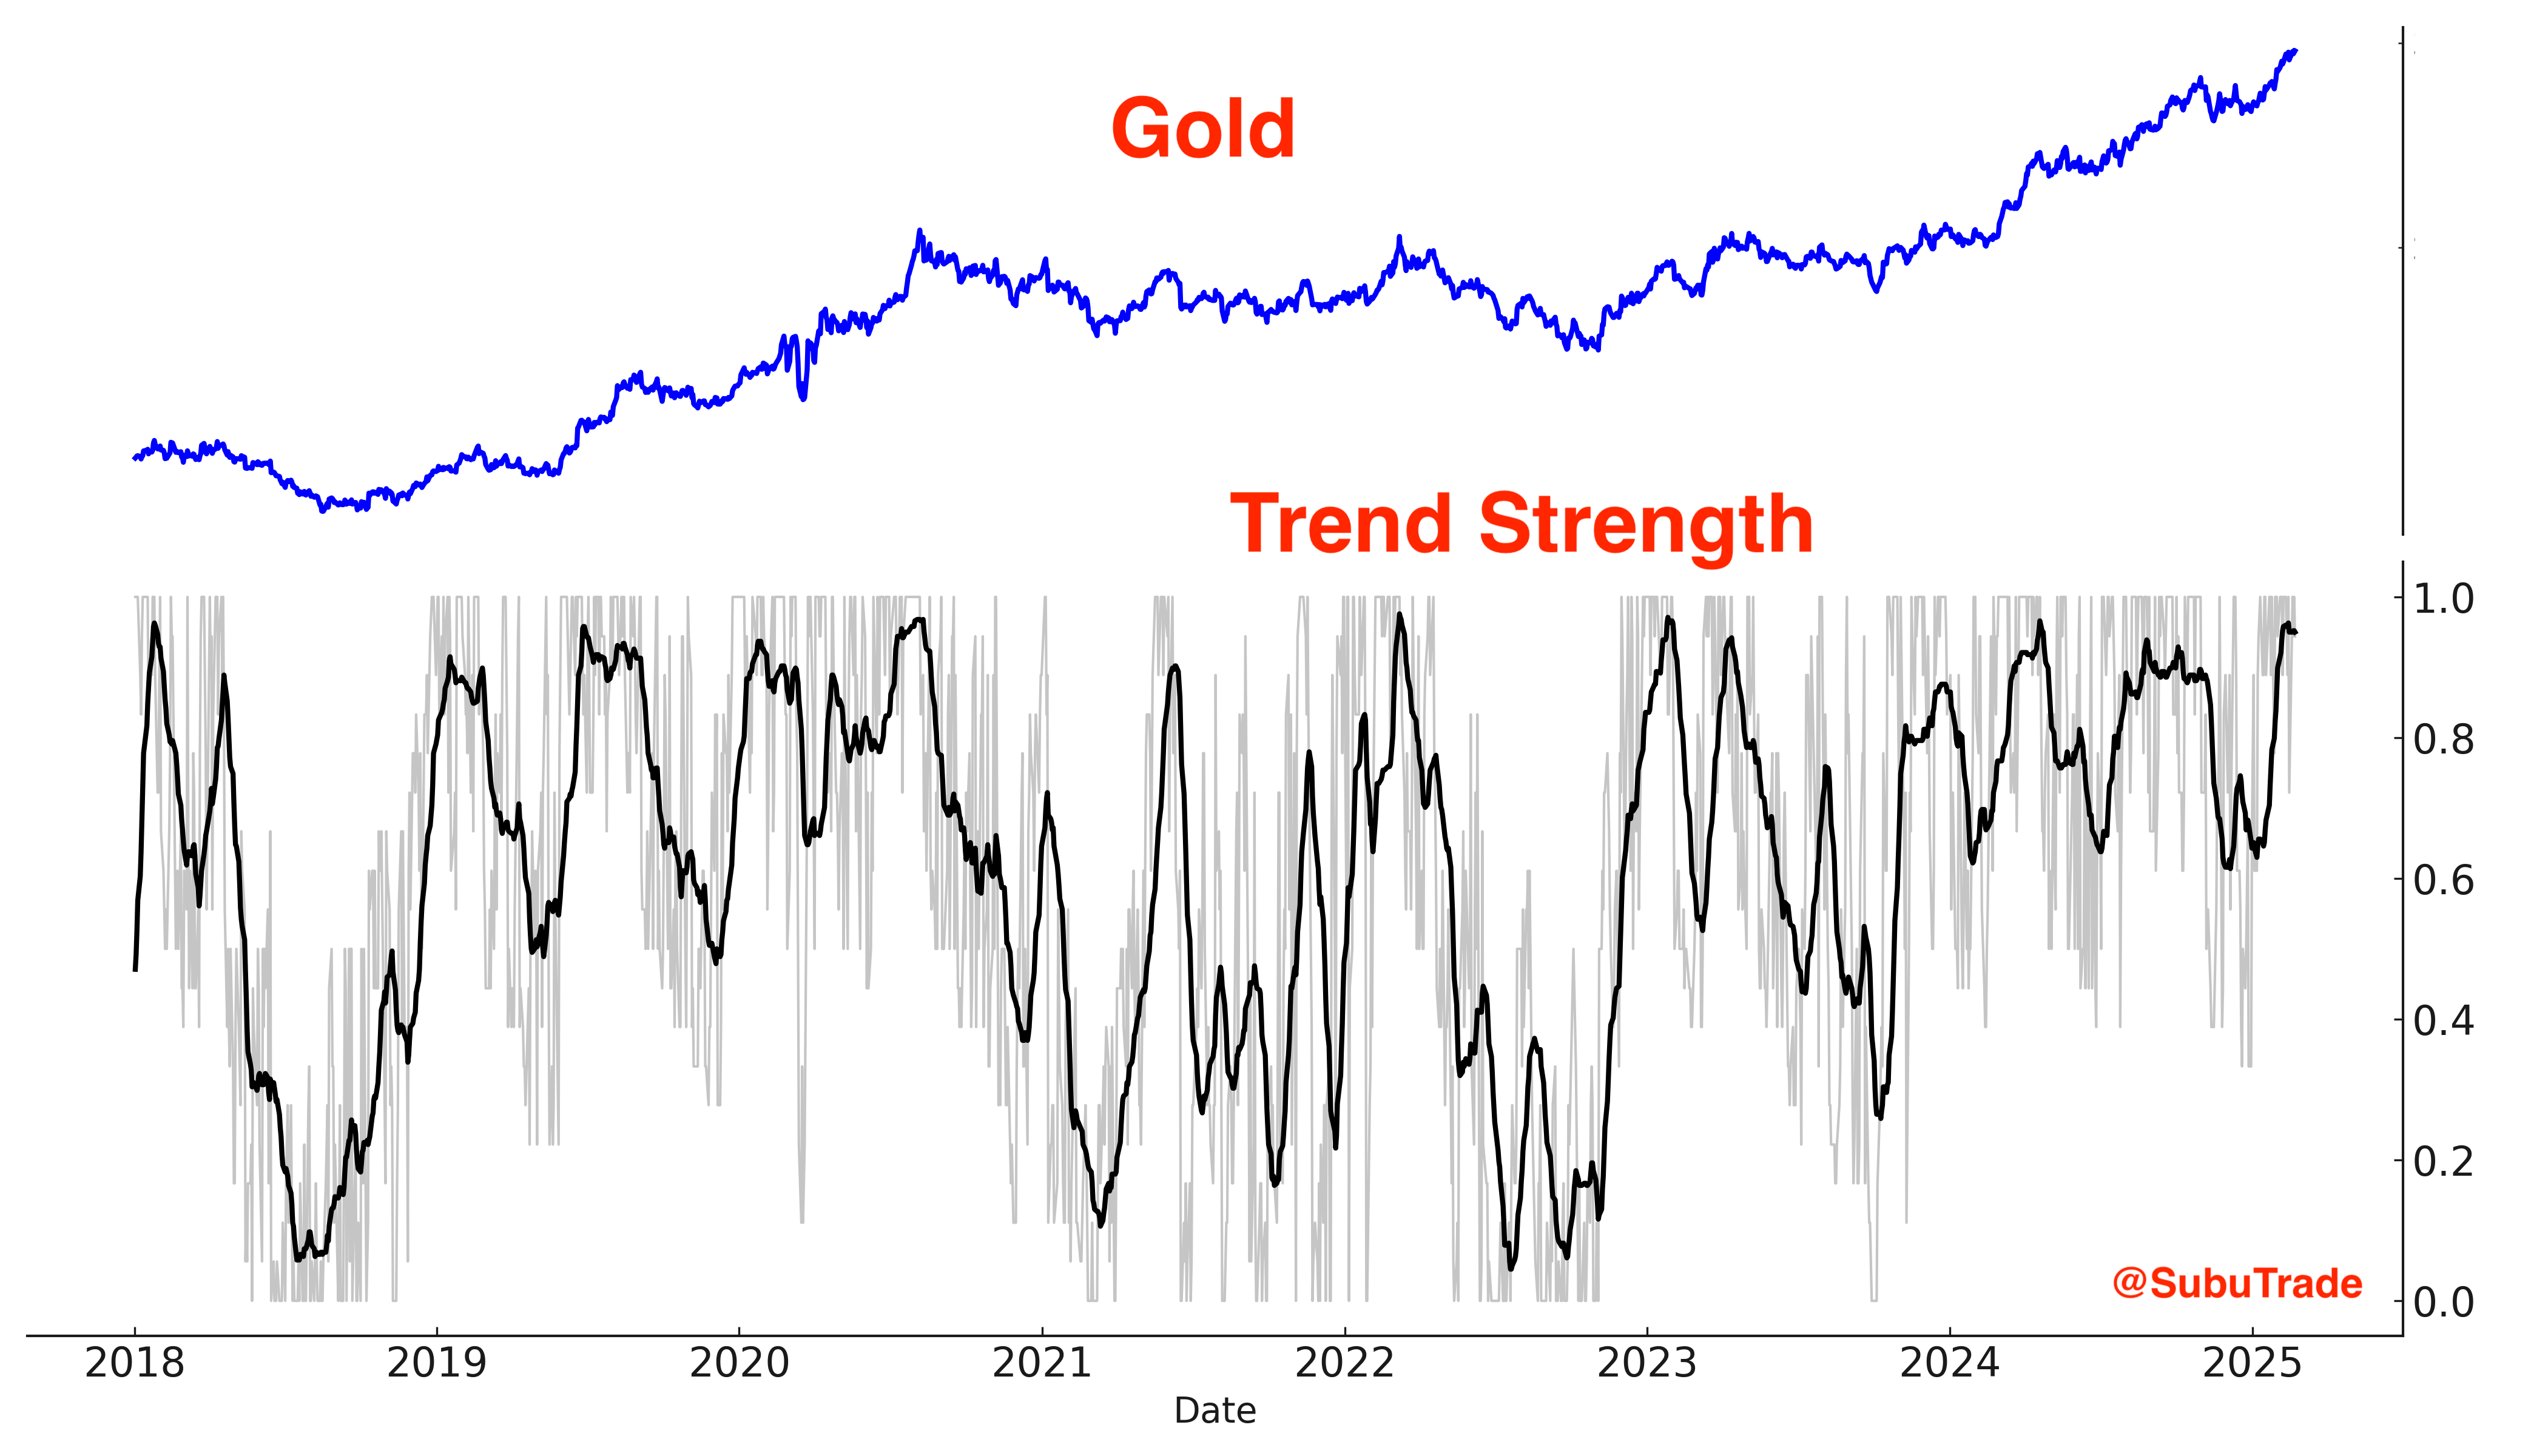
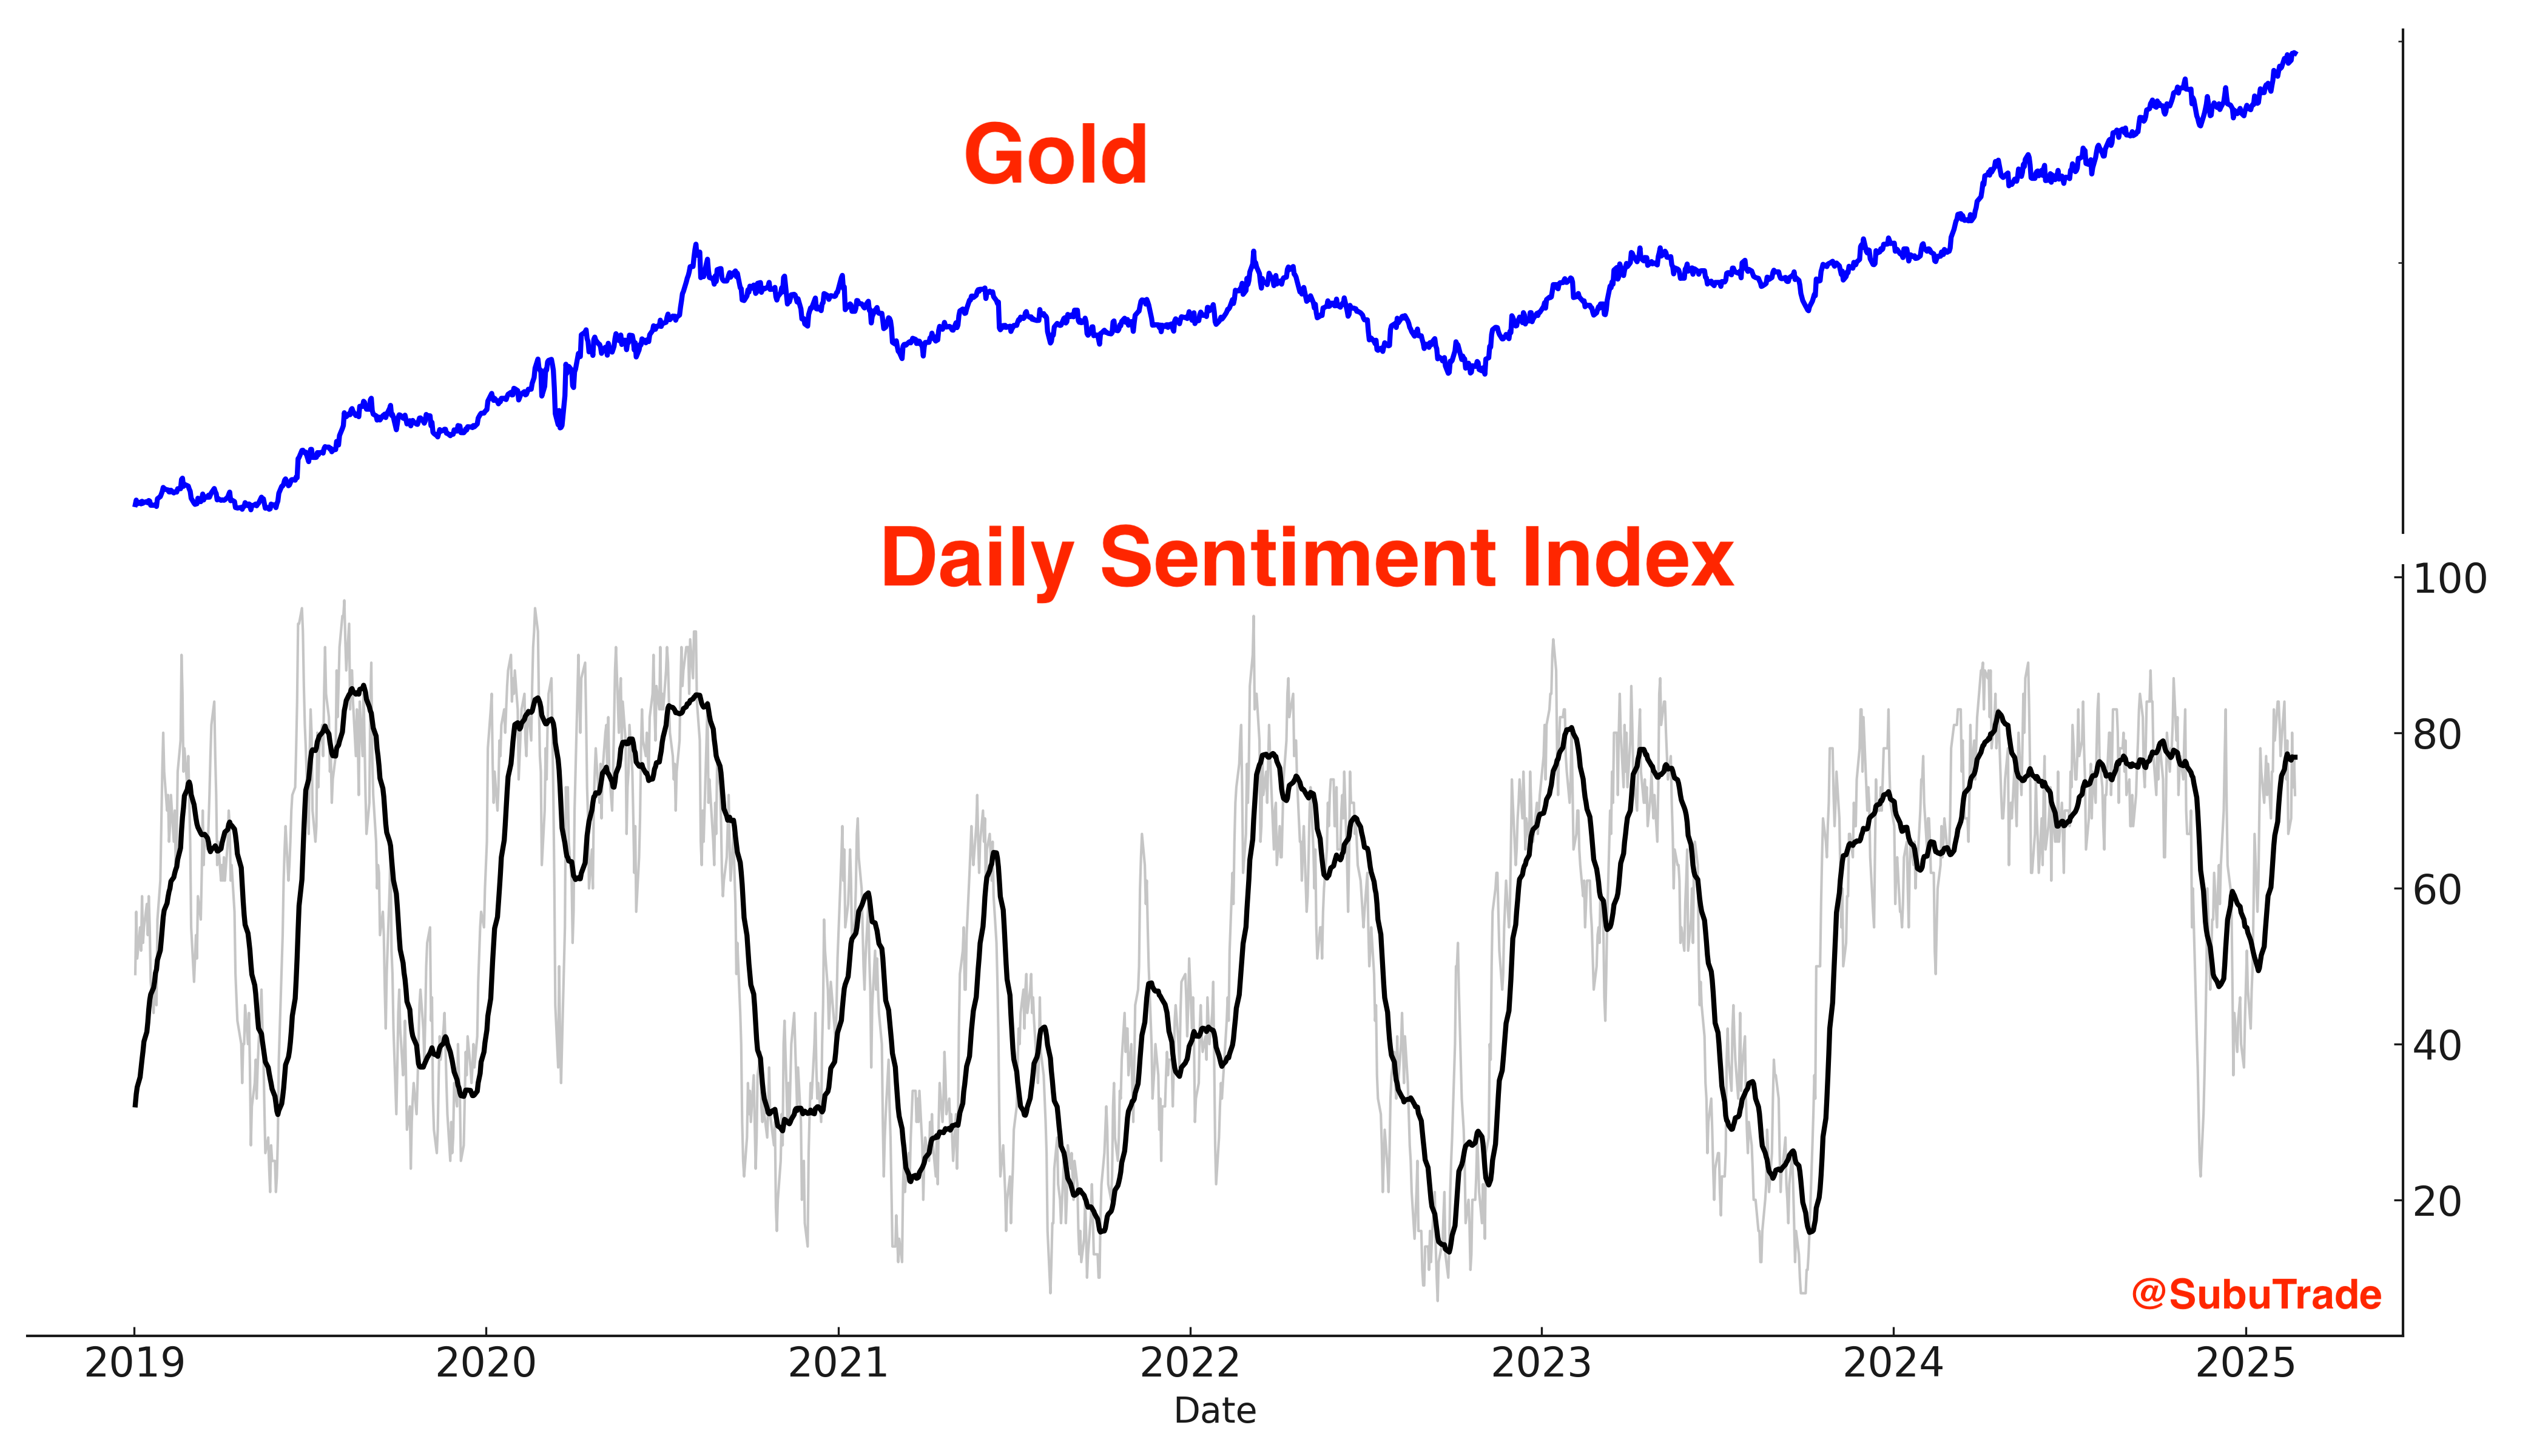
Gold’s Daily Sentiment Index is high, but not extremely high:
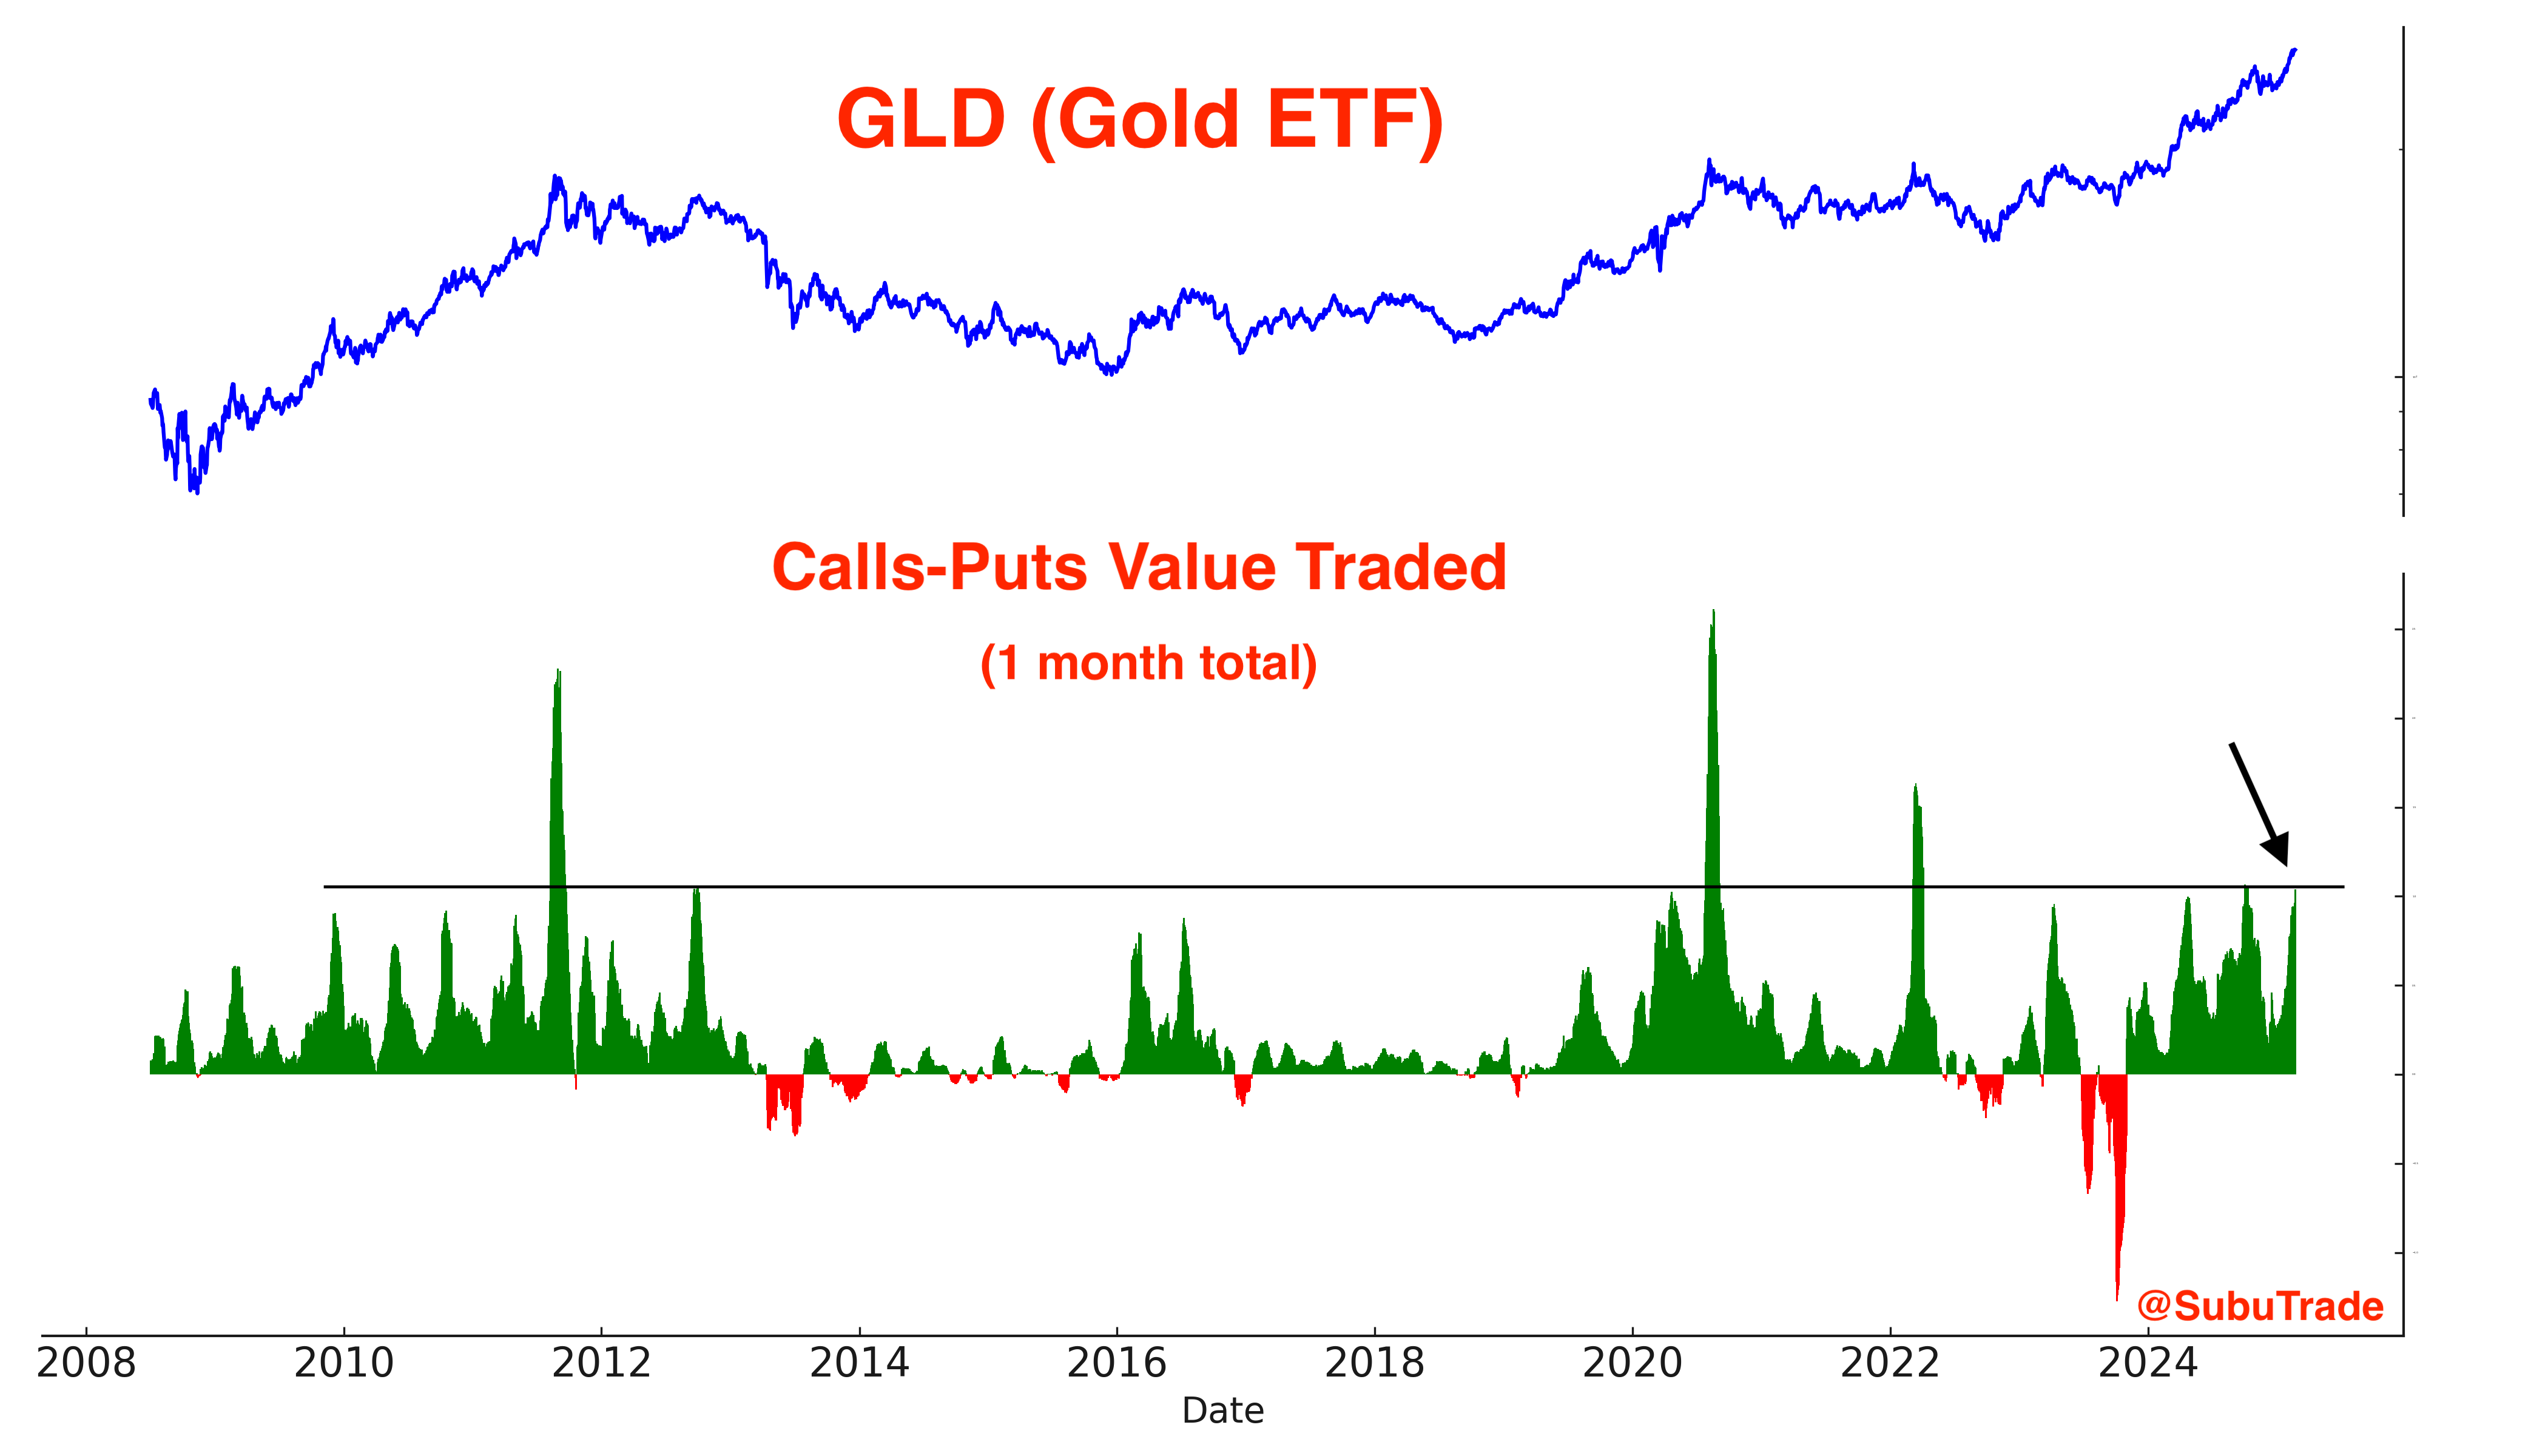
Options traders are starting to go all-in:
U.S. Treasury Bonds
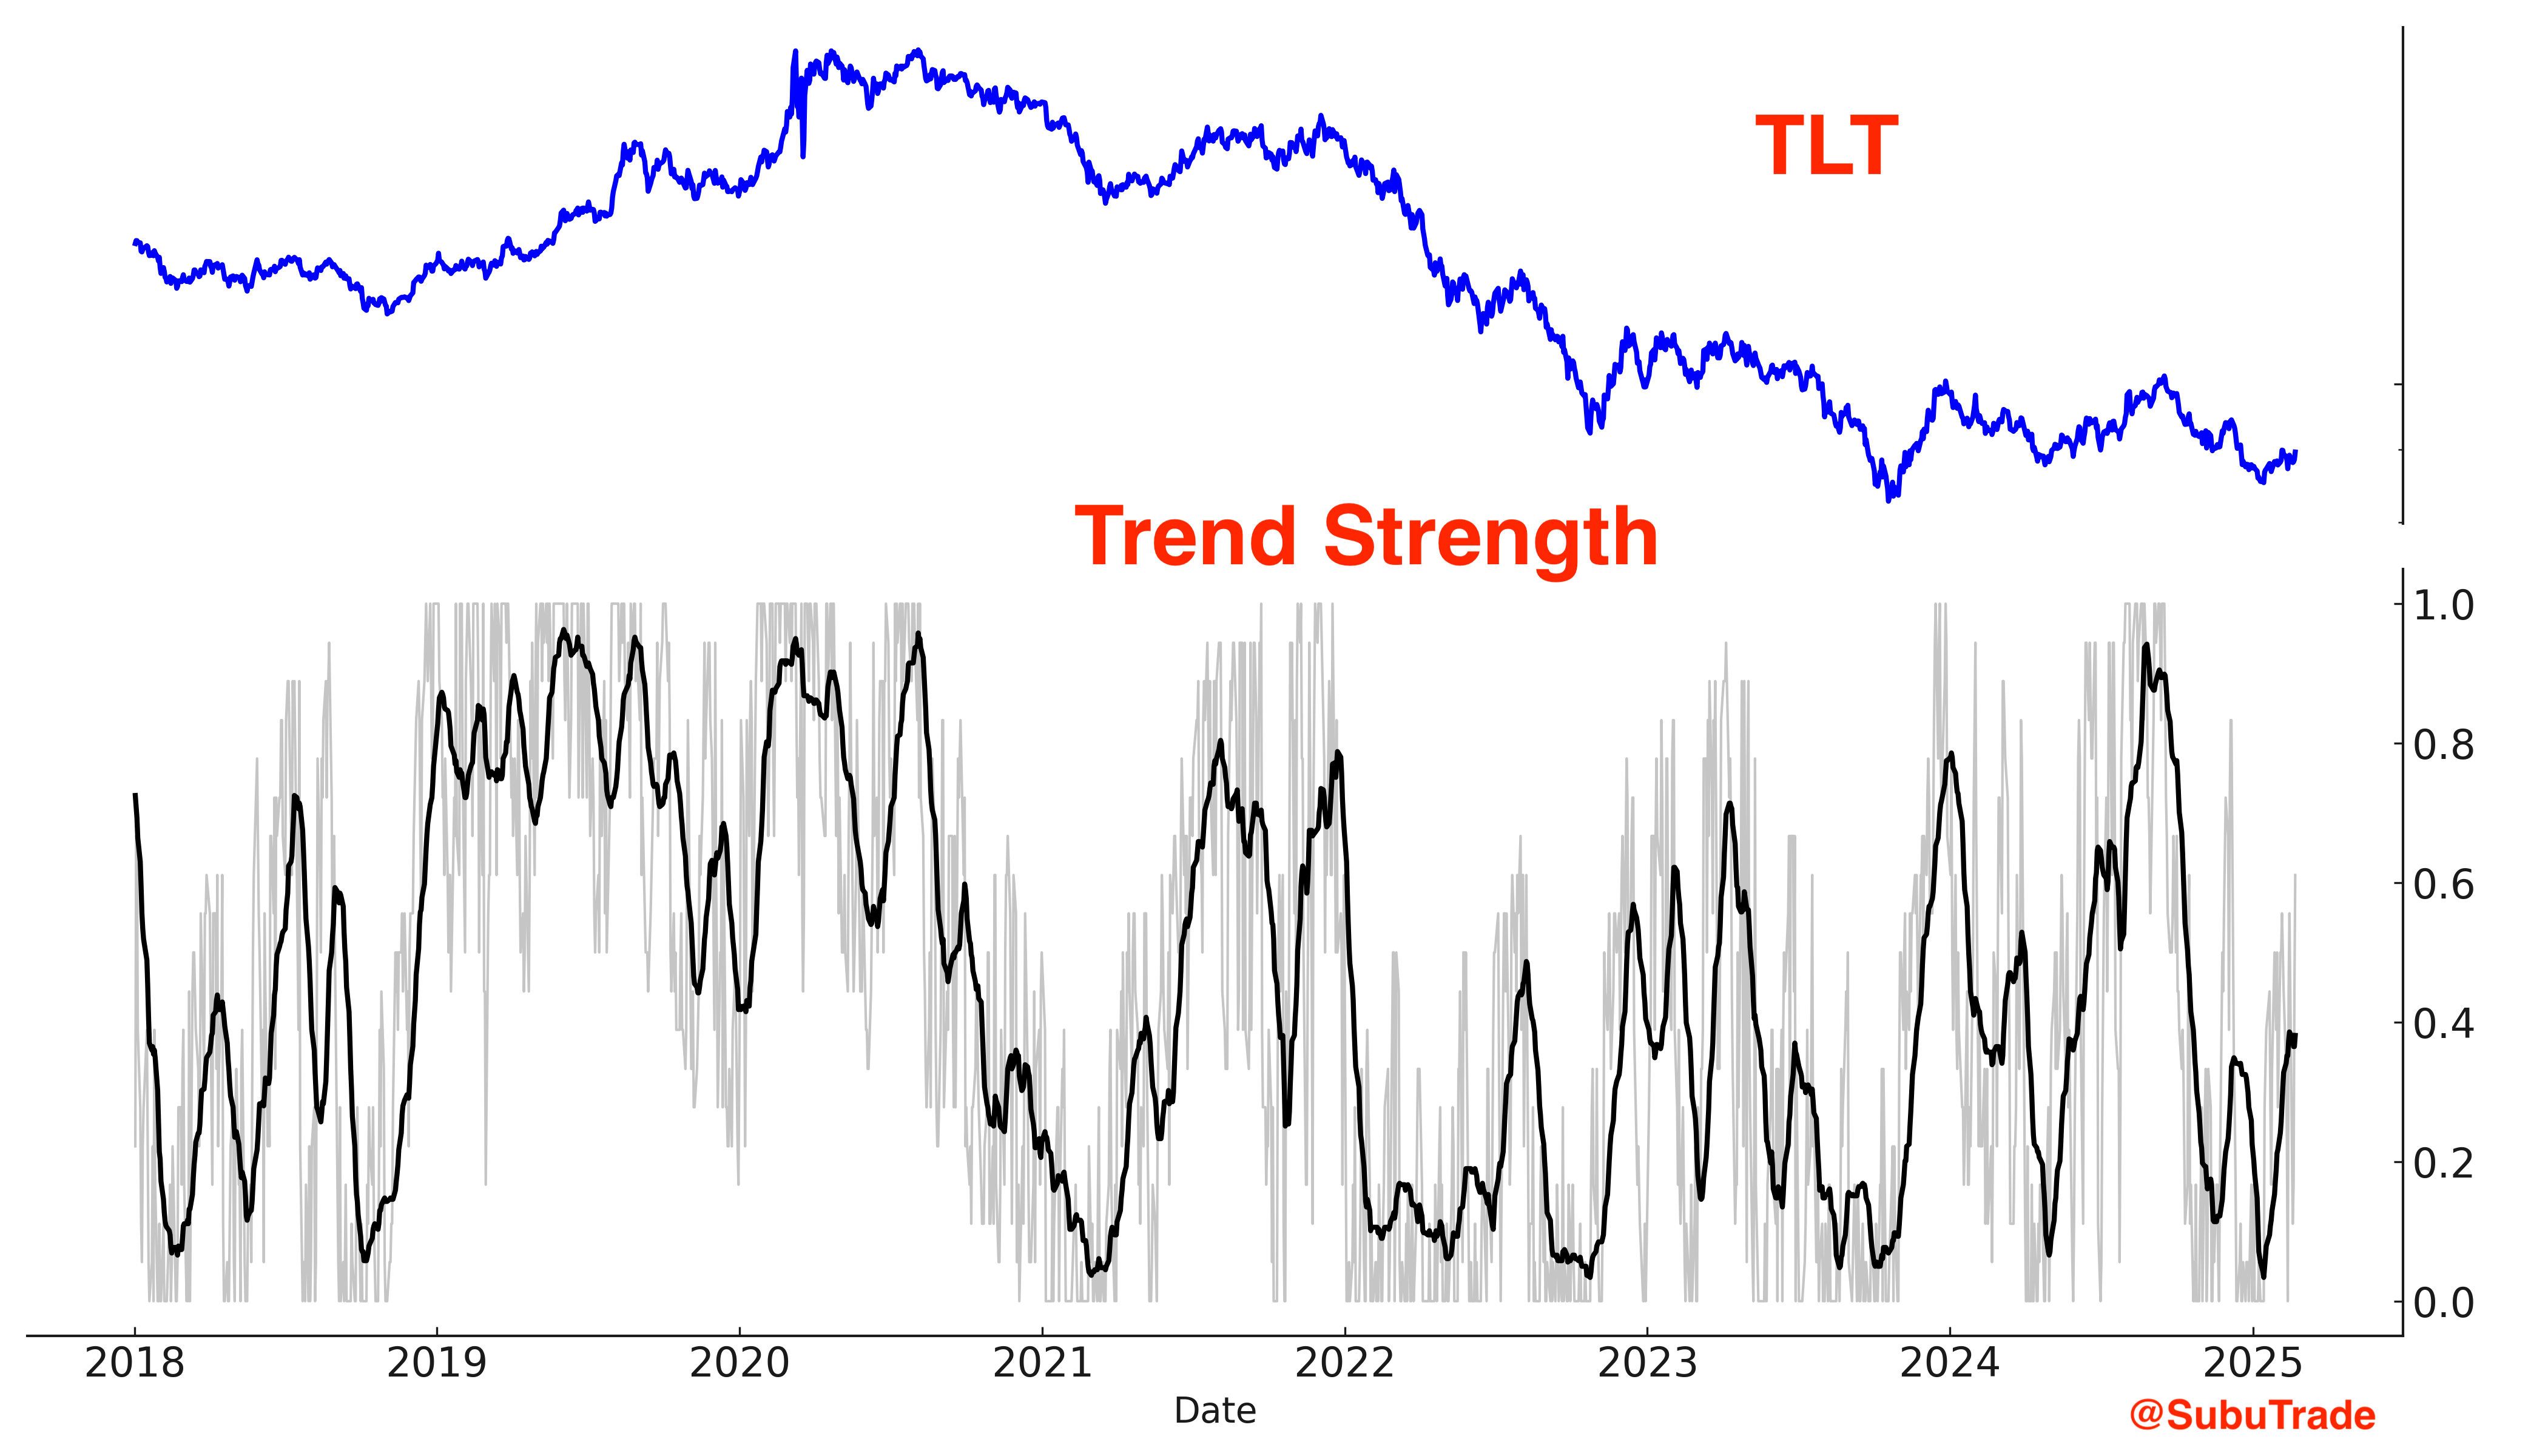
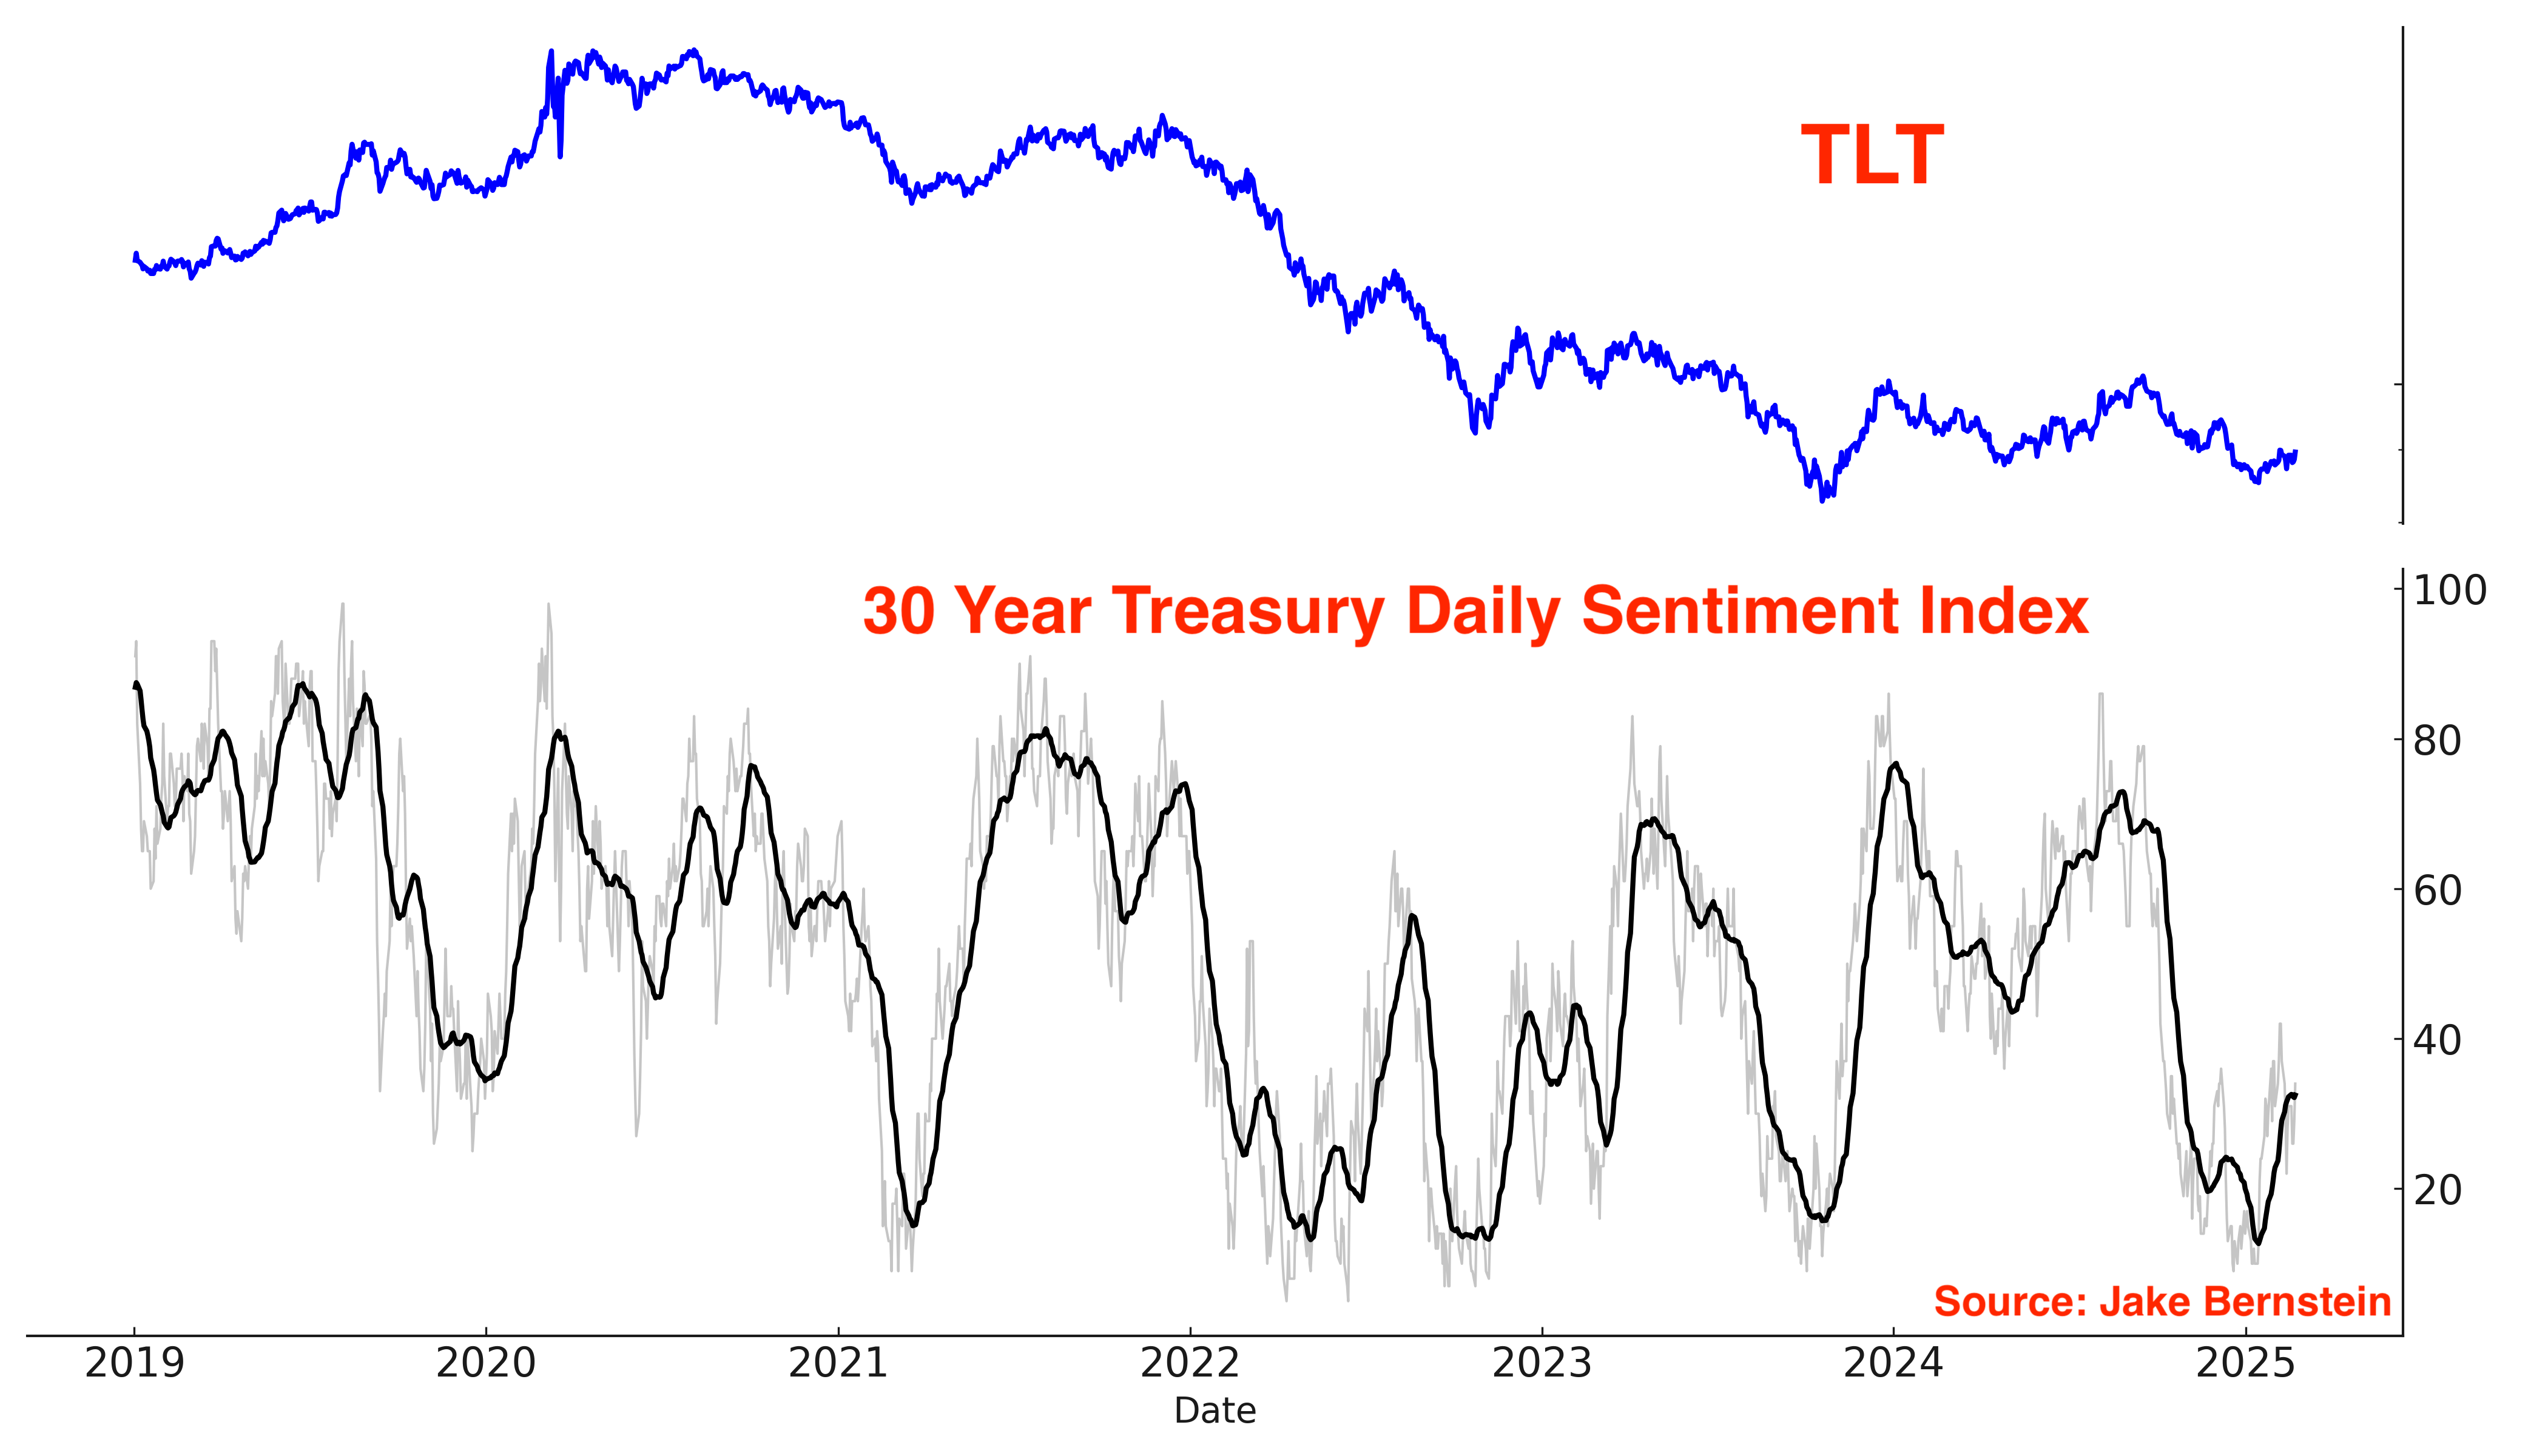
Treasury bonds are gradually trending higher, with an emphasis on "gradually."
Sentiment is slowly curling upwards:
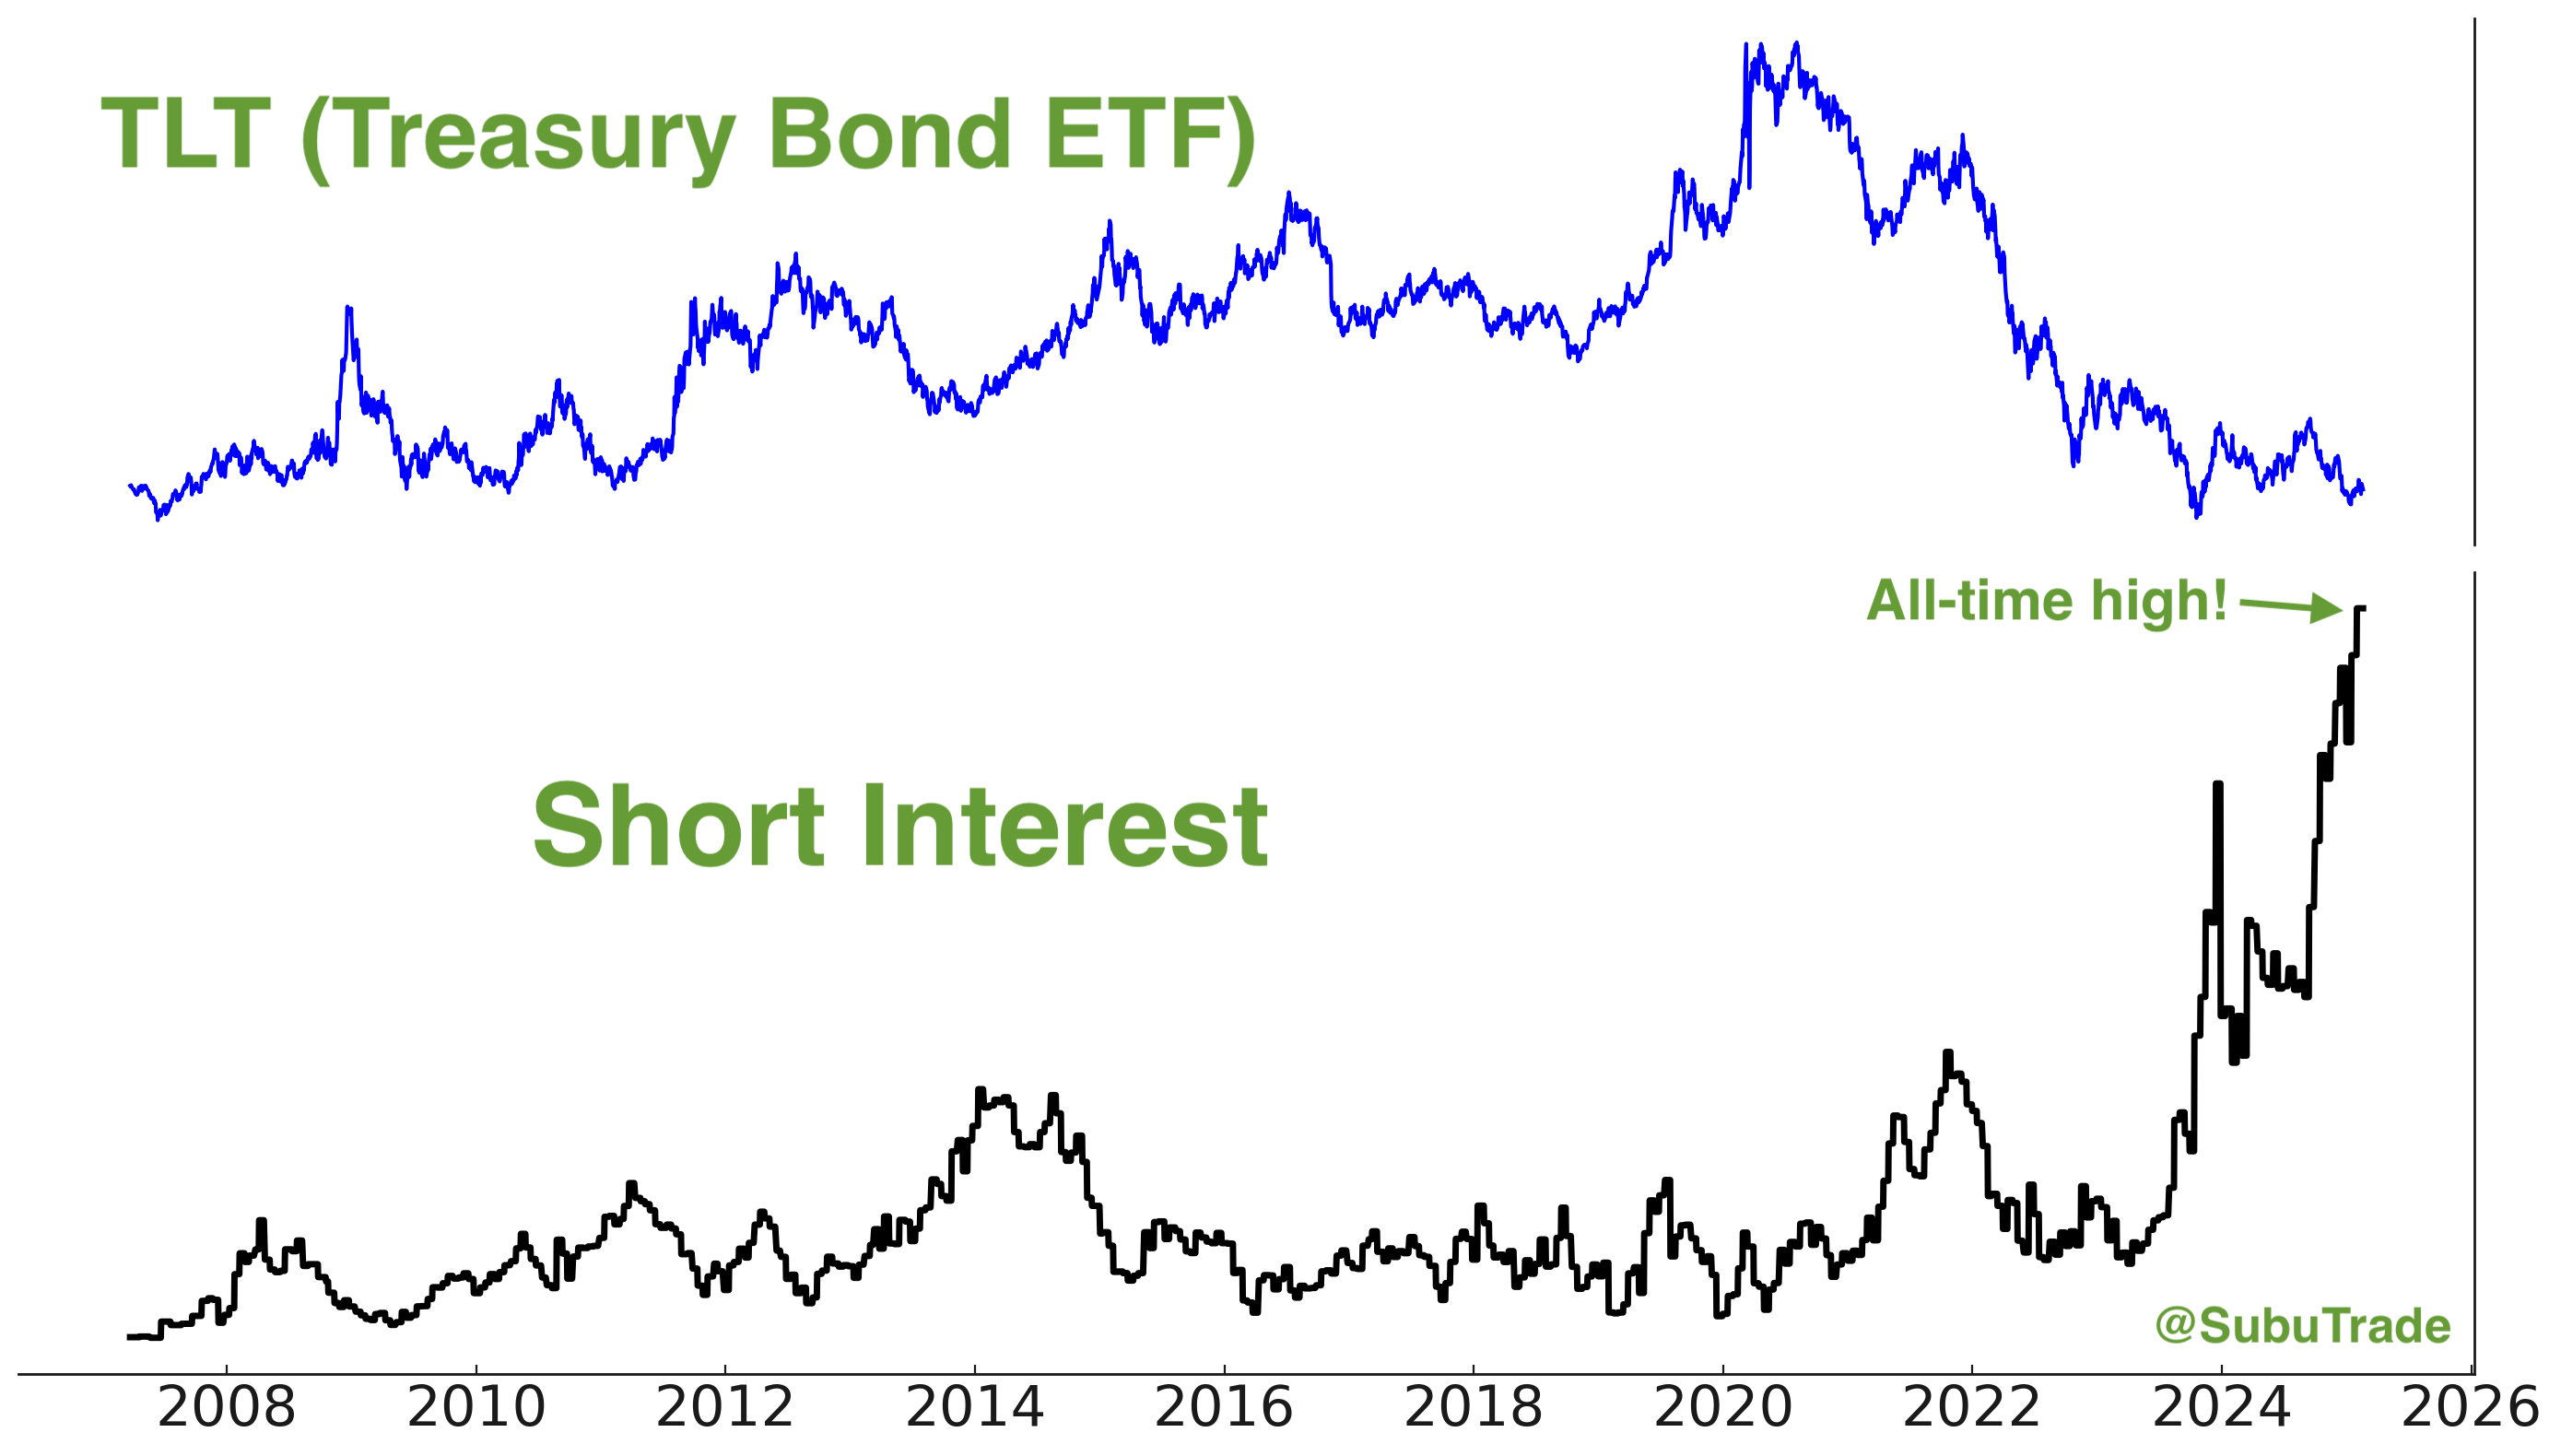
TLT short interest is at a new all-time high:
U.S. Dollar
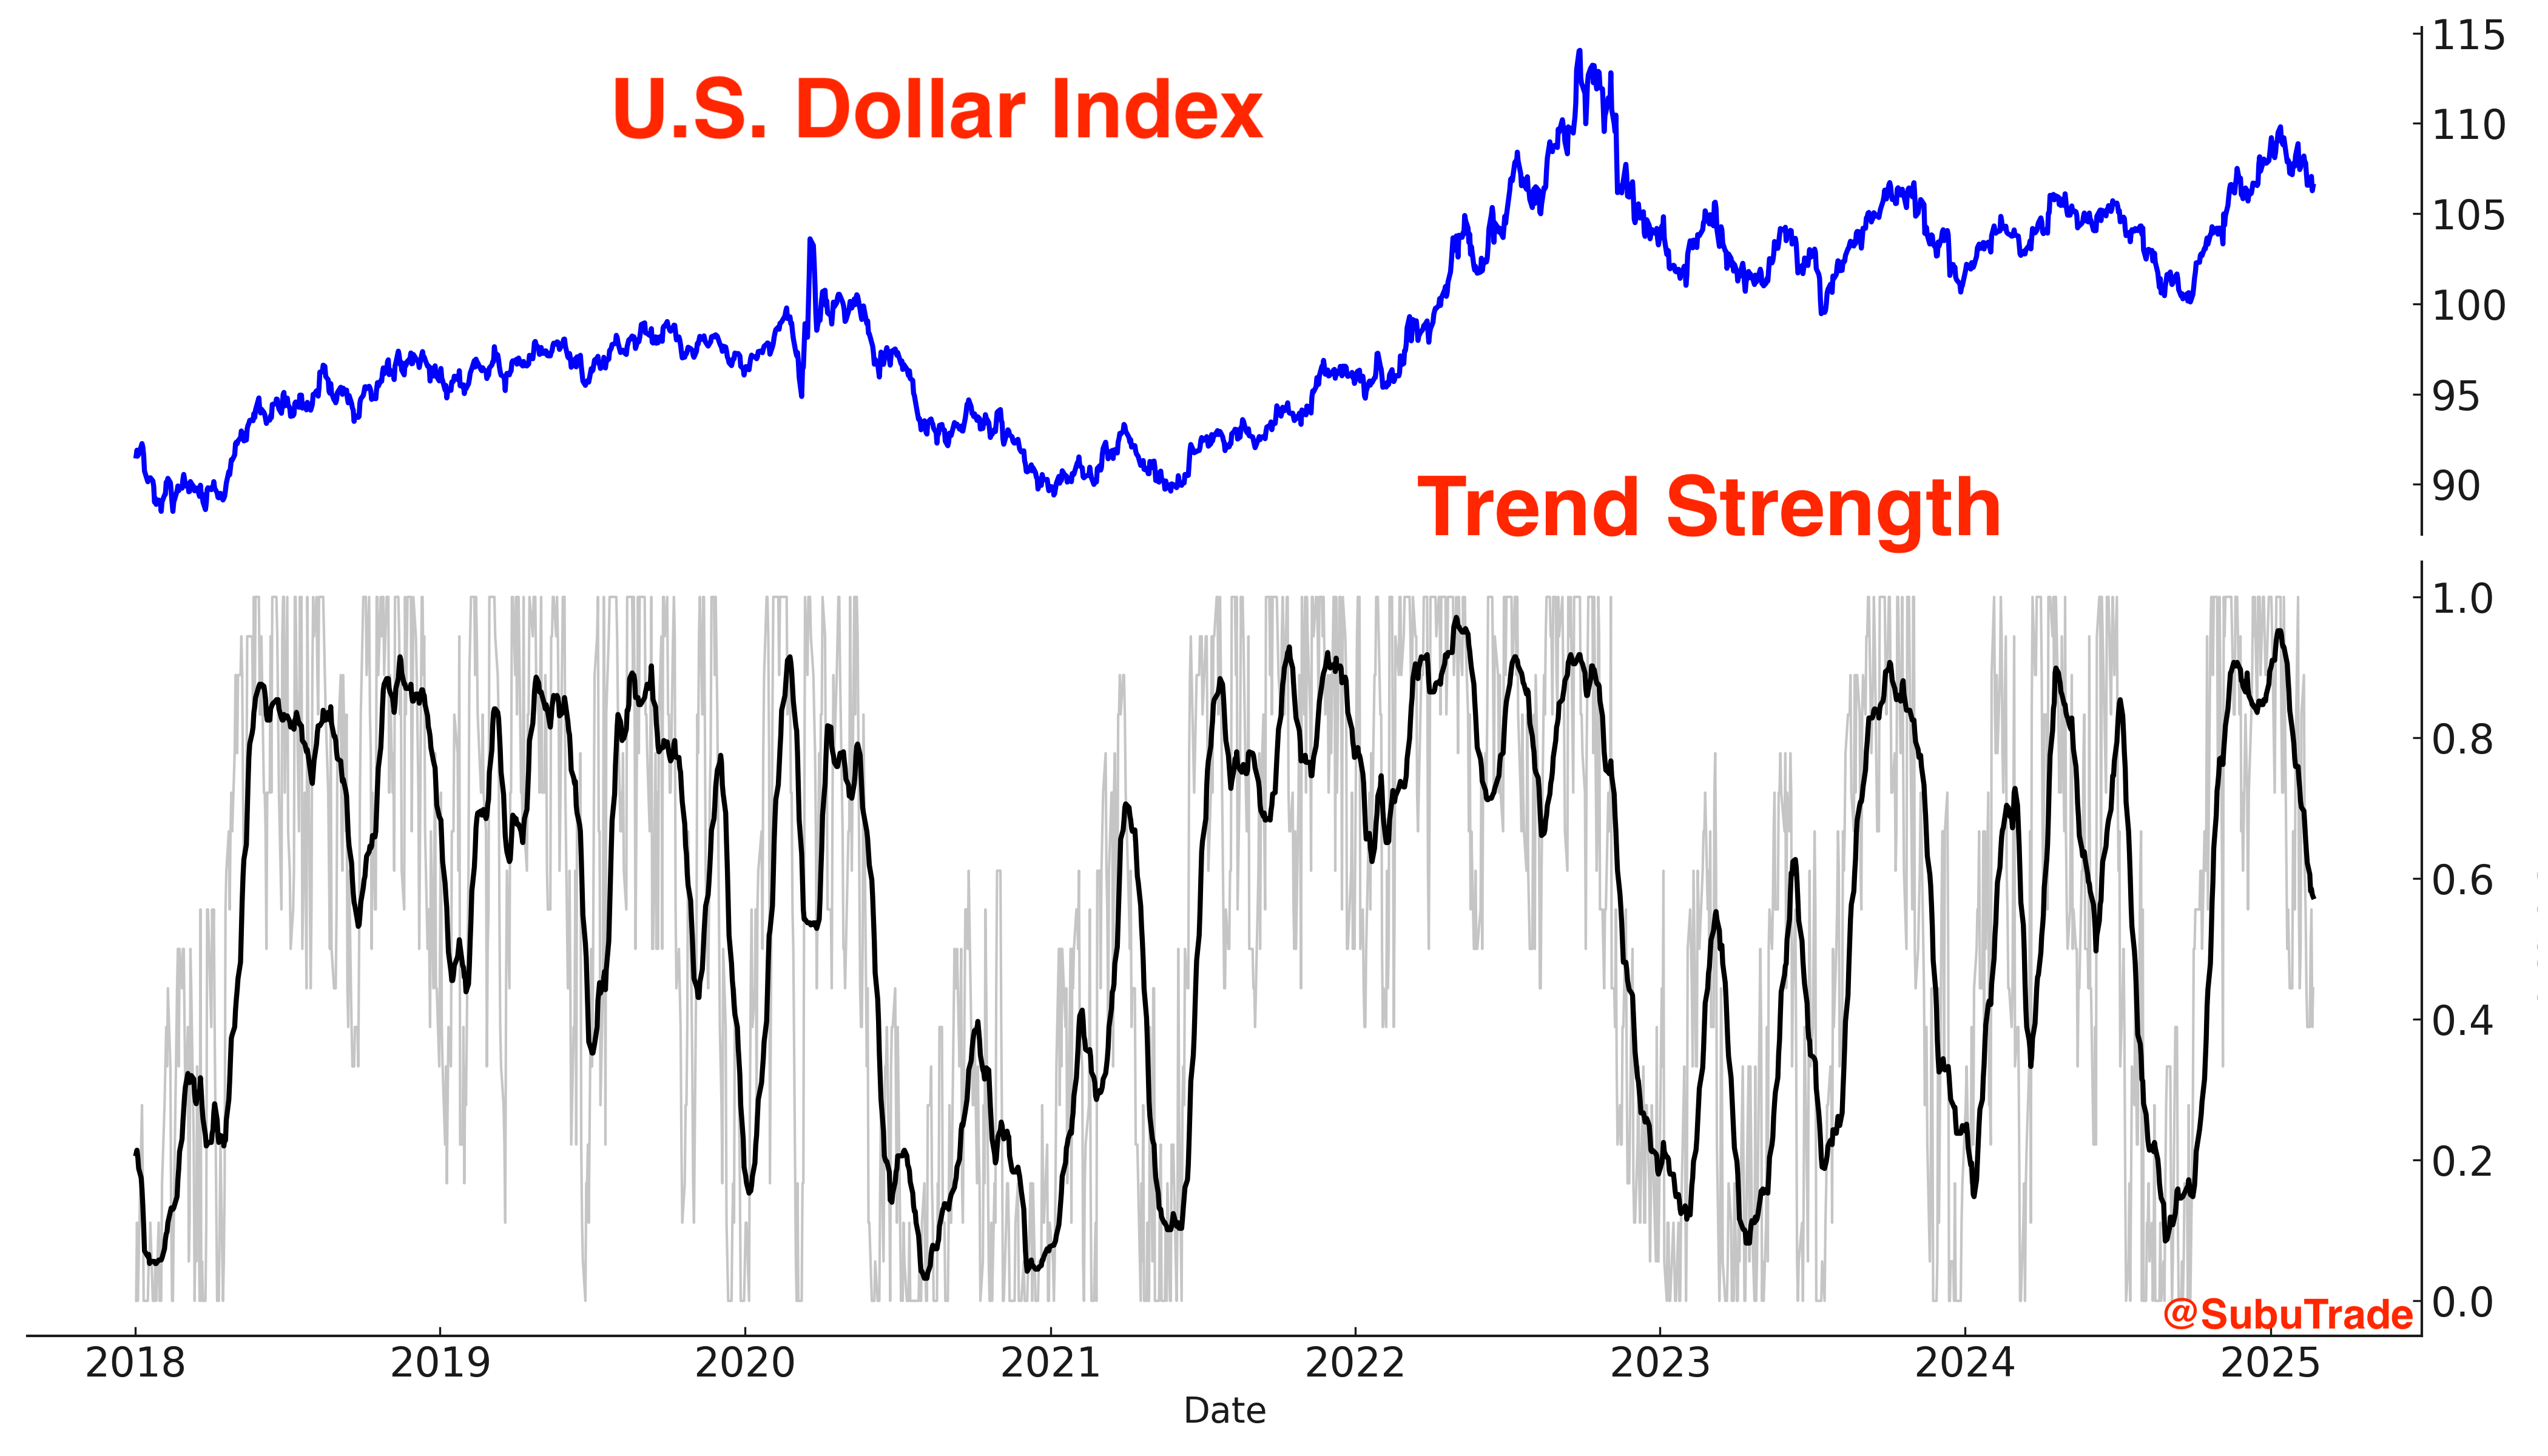
In contrast to bonds, the U.S. Dollar is gradually trending lower.
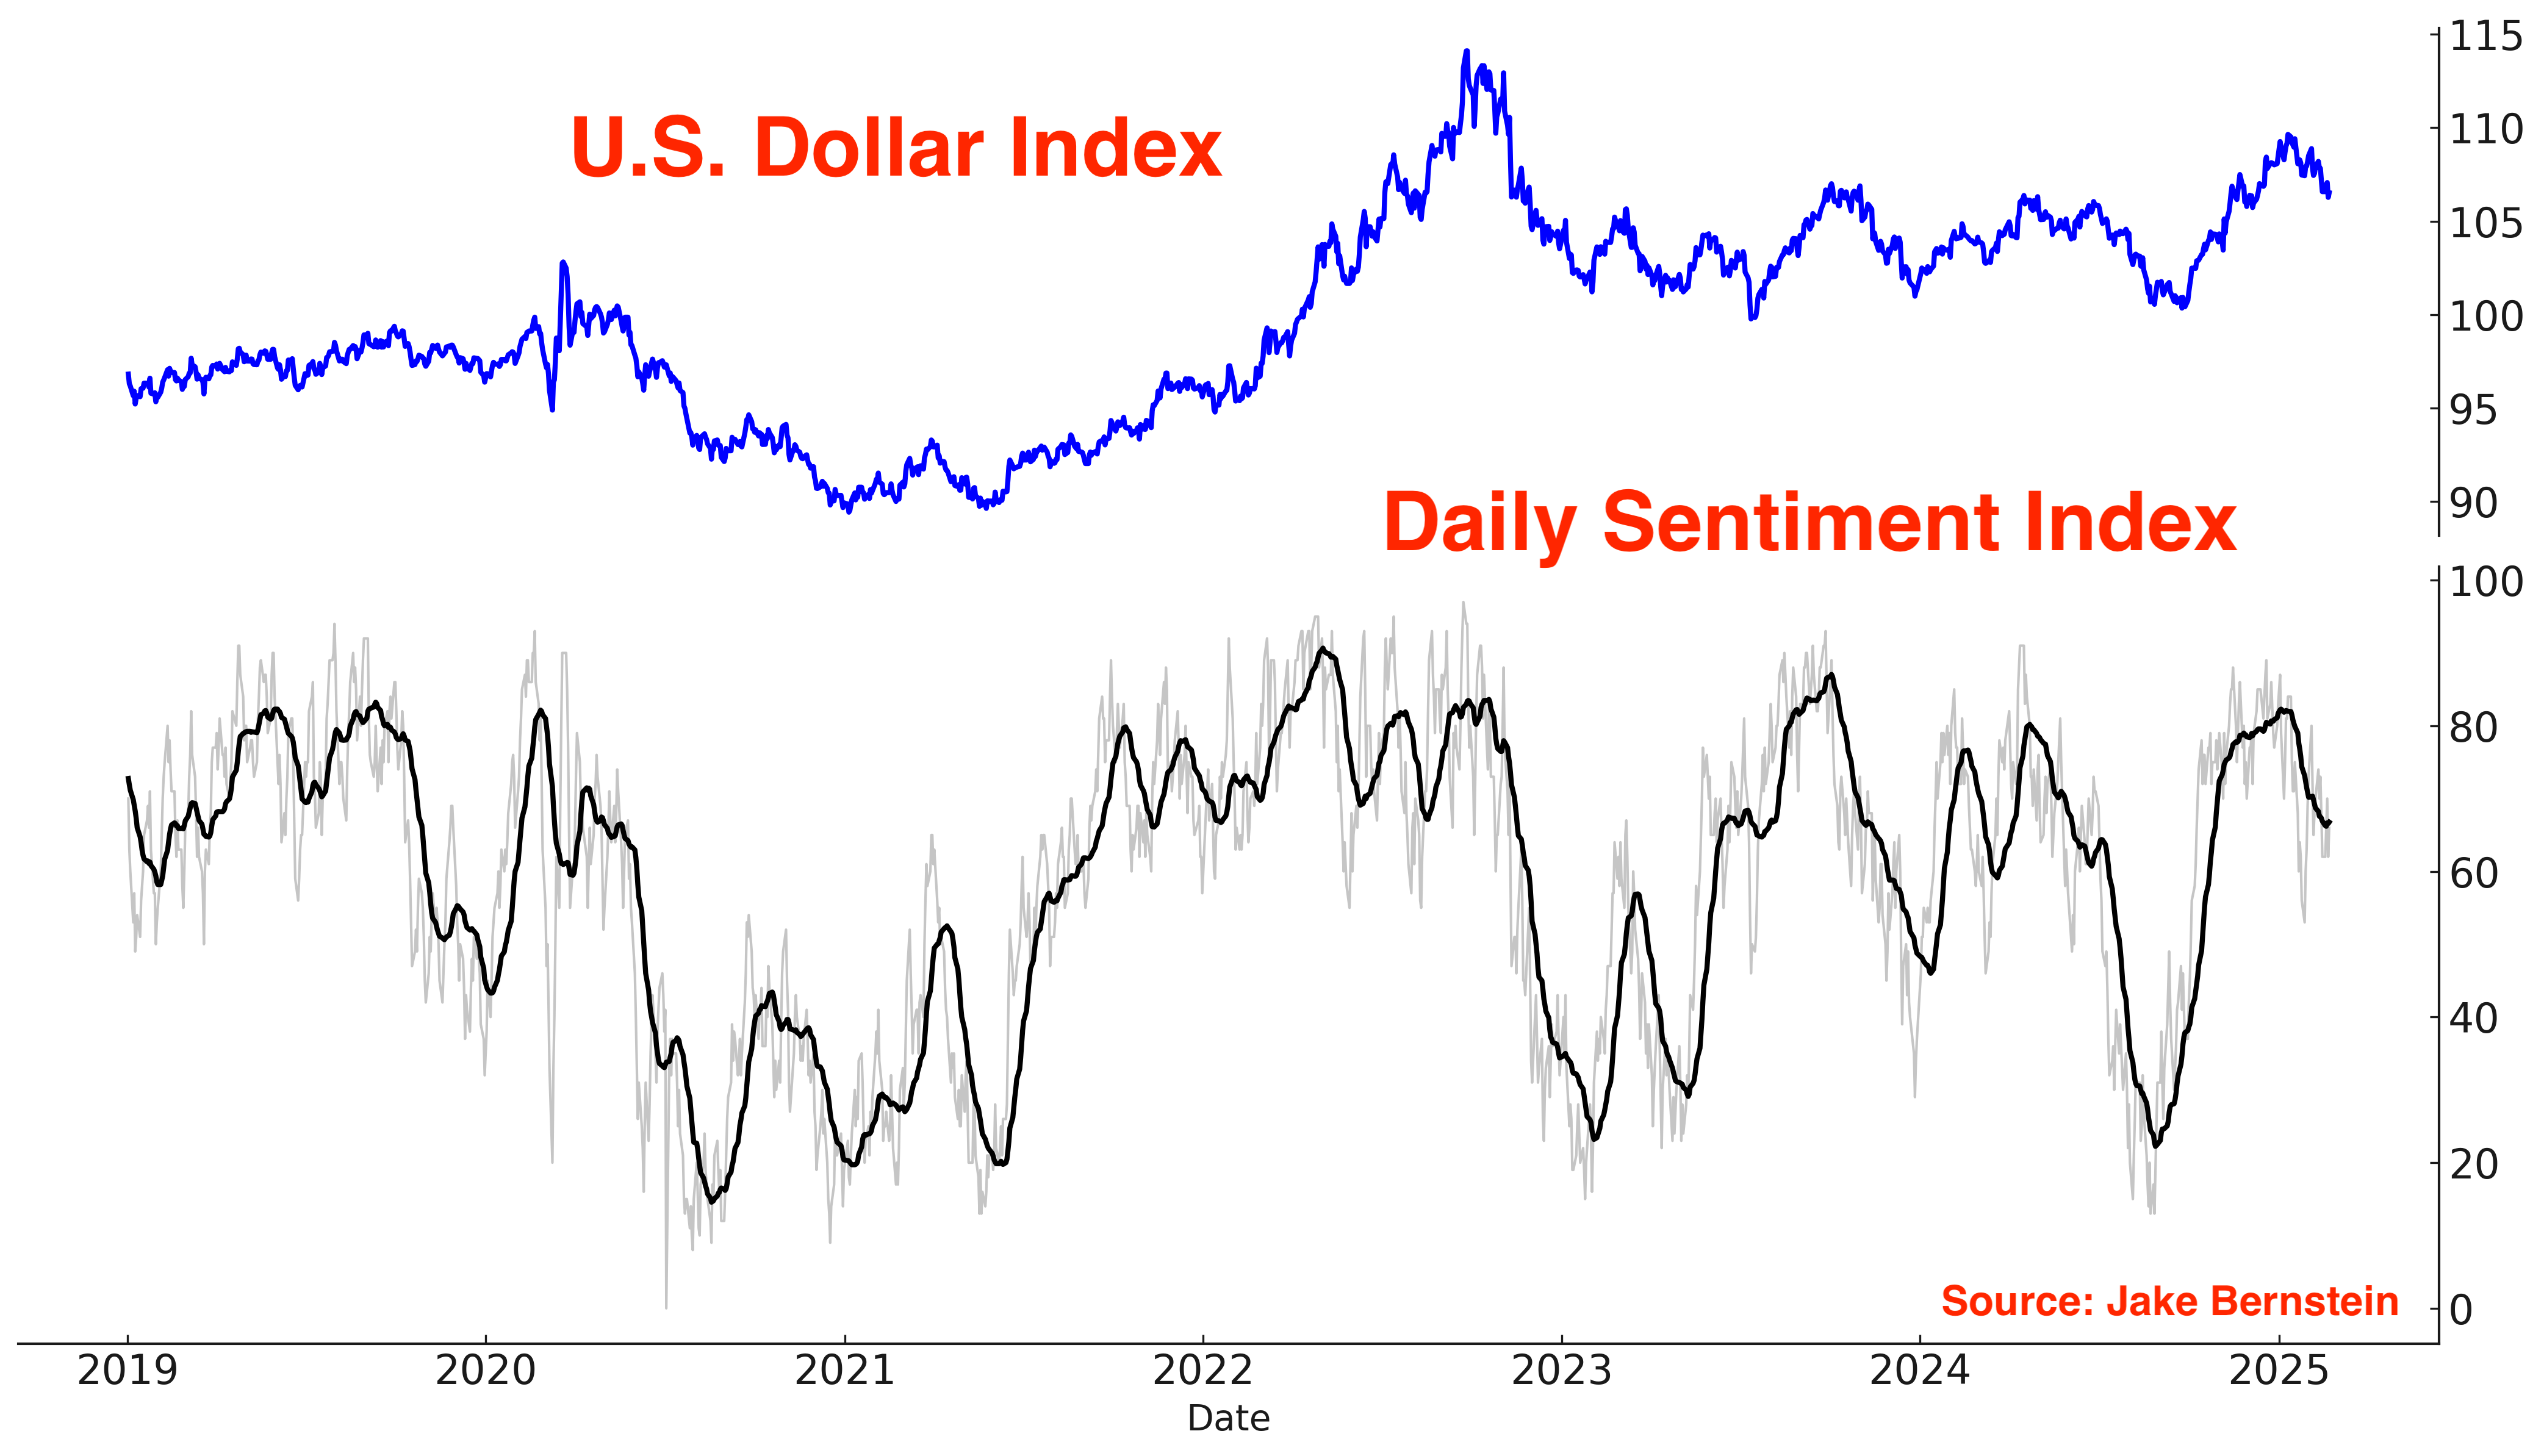
Sentiment is often a reflection of price. With the U.S. Dollar starting to trend downwards, sentiment is also falling:
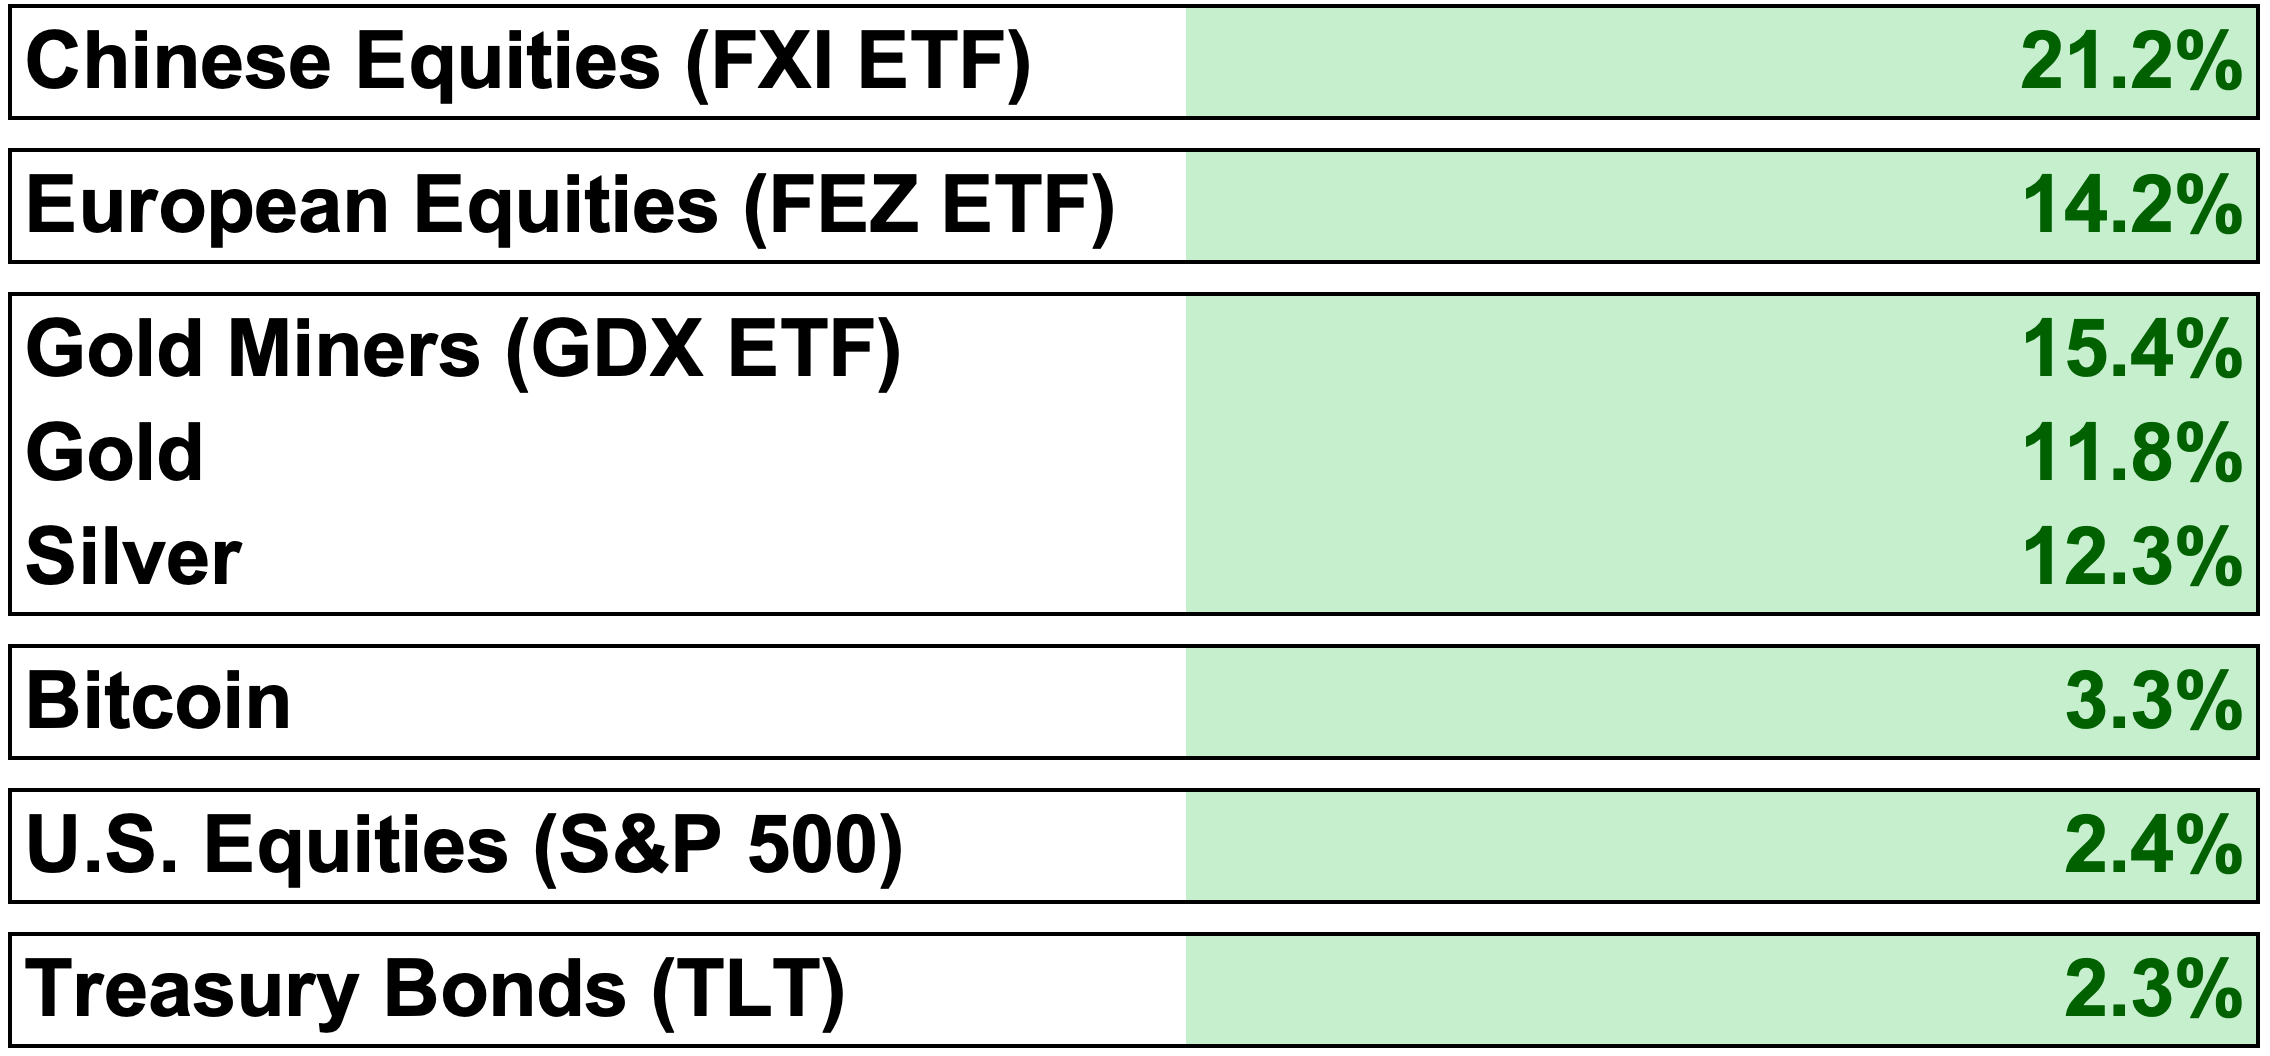
My Portfolio
*Click here if you don’t understand how I trade
Core Position – Long U.S. Equities: Maintaining a significantly underweight allocation. I remain neutral on U.S. equities, anticipating a market pattern similar to early 2015, characterized by sideways movement with marginal new highs.
Black Swan Position – Long Chinese Equities: Trimmed the position to manage the rising risk of a pullback or consolidation. The remaining exposure will be held with a trailing stop.
Core Position – Long Gold and Silver: Reduced exposure to account for the increasing risk of a short-term pullback or consolidation. The remaining position will be held with a trailing stop.
Mean-Reversion Position (Non-Core) – Long U.S. Treasury Bonds: Reduced exposure due to weak price action.
One final note: My friend Jason Perz runs an excellent Substack, Against All Odds Research. If you haven’t already, I highly recommend checking it out. He and I share similar market perspectives.
💯👊🏼👏
Terrific post and greatly appreciated. China equities, IMO, are OK for trading but remain extremely risky for a LT investor. There is a new generation of investors who need to realize that China cannot be trusted to protect overseas investors.