Market Report: volatile U.S. stock market, but big opportunities elsewhere?
The U.S. stock market has been volatile. There are also big opportunities in bonds, commodities, and Indian stocks.
The U.S. stock market has been volatile over the past 2 weeks, overall going nowhere. In today’s Market Report I’ll explain my outlook towards:
U.S. equities
Bonds
Commodities (energy and gold)
Indian equities
Let’s dive in.
U.S. Stock Market
The U.S. stock market is trending sideways.
Long term (1+ year): there are major long term bearish factors which will hurt the stock market in 2025.
Medium term: the recent pullback is not enough to be classified as “panic selling”. This doesn’t mean that the stock market cannot bottom here; it just means that we haven’t experienced a true washout yet.
Stay cautious and alert in 2025. There are too many long term warning signs to ignore, even if the stock market bounces and makes new highs. A possible scenario is that 2025 may be like 2015 when the stock market swung sideways for months before crashing in August 2015.
Options Flows
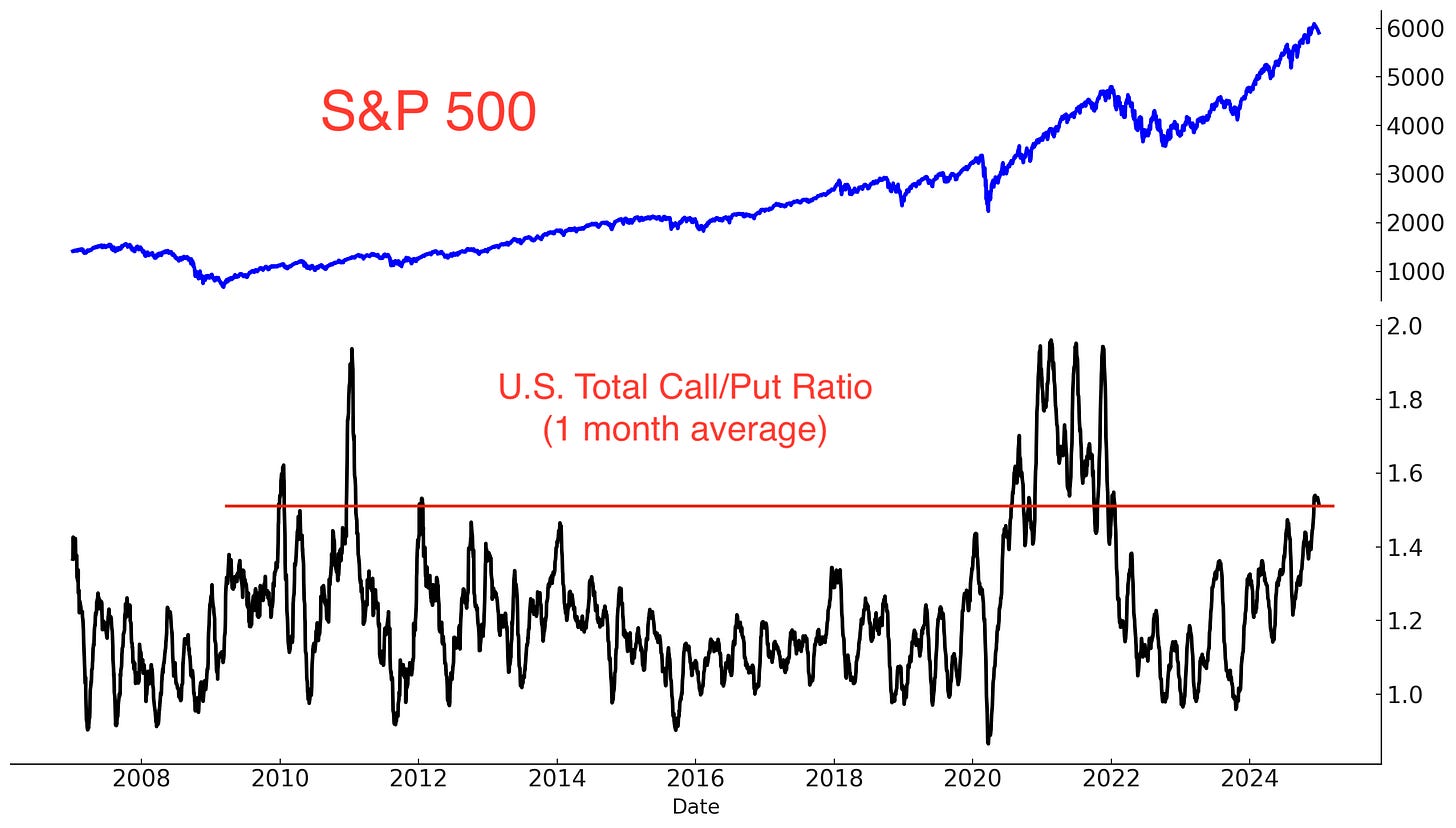
The Total Call/Put Ratio remains elevated despite the recent pullback in stocks. Such speculation was last seen during the 2021-2022 COVD bull run, and is a long term bearish factor:
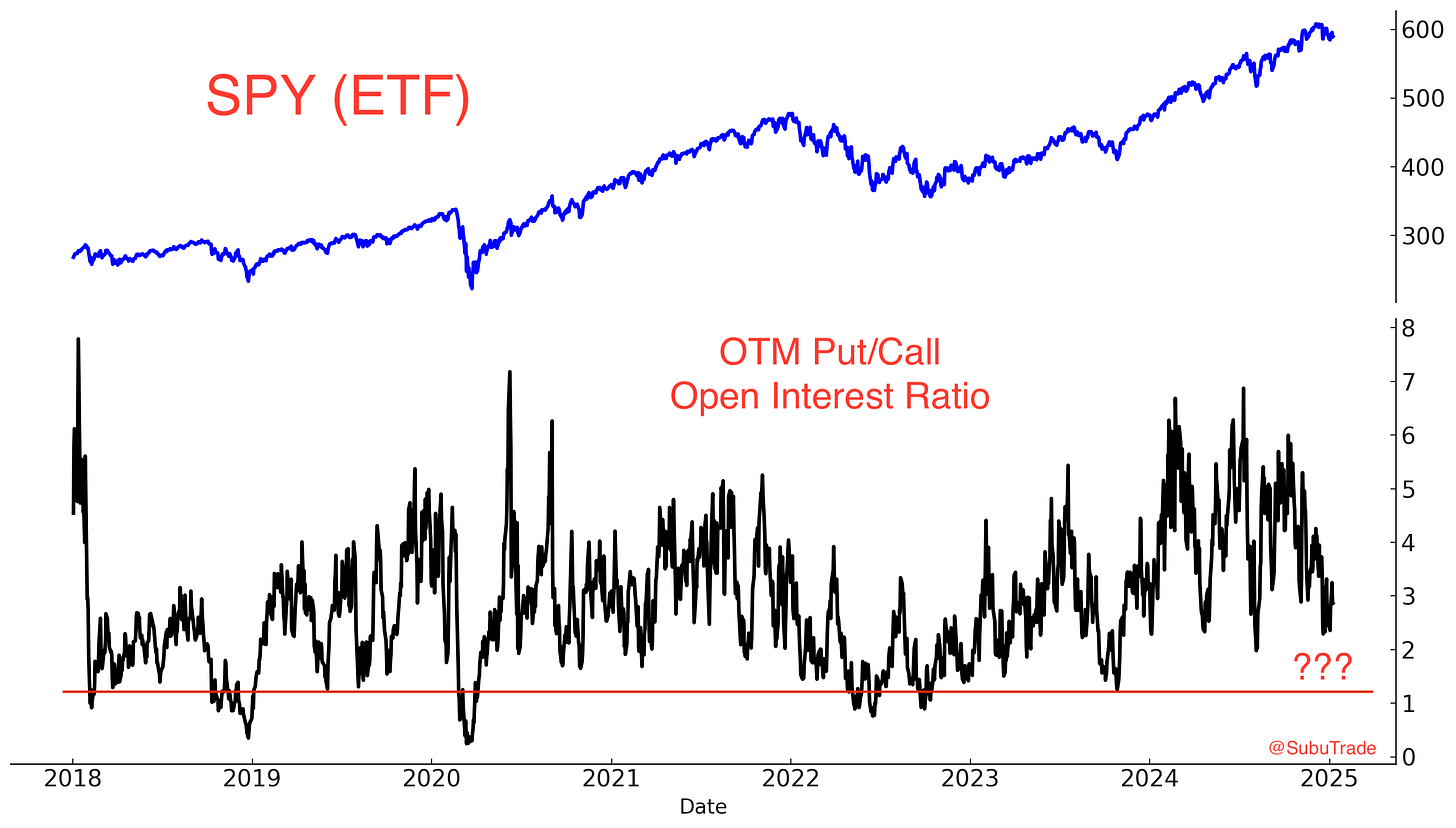
The S&P 500 hasn’t dropped significantly, so many Put options remain Out of the Money (OTM) compared to Calls. The OTM Put/Call Open Interest Ratio tends to fall as the stock market falls, since a falling stock market makes more puts In the Money and more calls Out of the Money. This is a medium term neutral factor which suggests that the stock market hasn’t fallen enough to be labelled as “panic selling”:
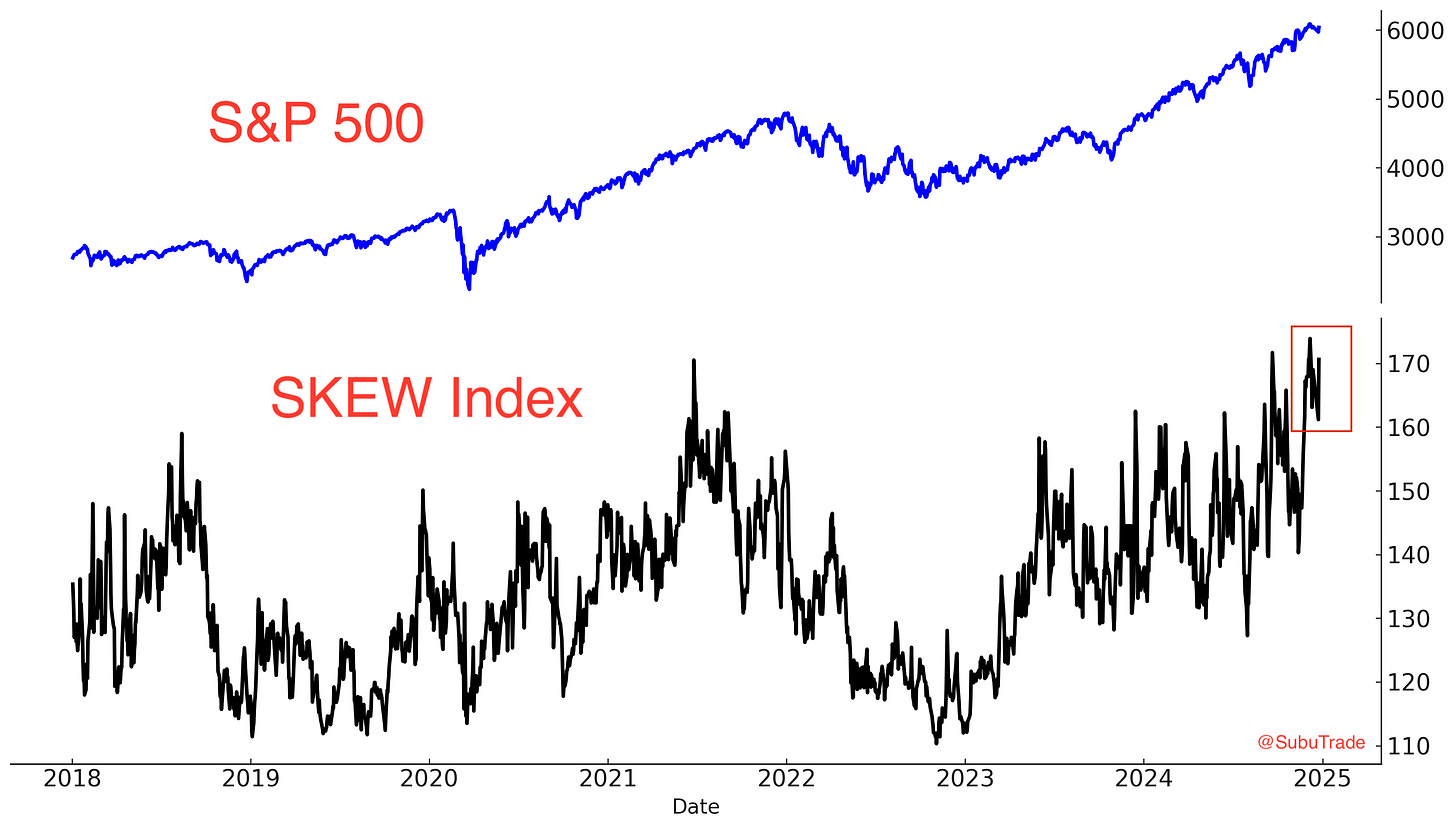
The SKEW Index, which measures the risk of extreme movements in the stock market (i.e. crash), remains very high despite the recent pullback. This is a long term bearish factor:
Fund Flows
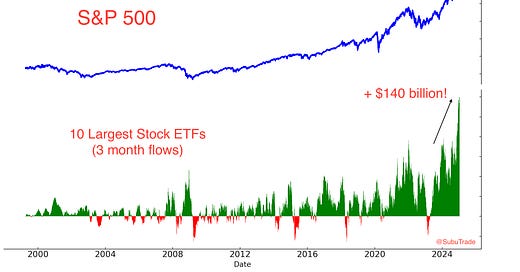
As I shared on Twitter/X: the 10 largest U.S. stock market ETFs have seen a record +$140 billion in inflows over the past 3 months.
Even adjusted for the stock market’s capitalization, this was only matched by 2 other times:
January 2015: After a big 2 year rally, stocks chopped sideways & crashed in August 2015.
January 2017: After a volatile 2 years, the initial optimism from Trump’s first presidency sparked a wave of buying. This marked the start of the 2017 bull run.
Today is more similar to the 2015 case in terms of stage analysis: we ALREADY experienced a big 2 year rally. This is a long term bearish factor.
Corporate Insiders
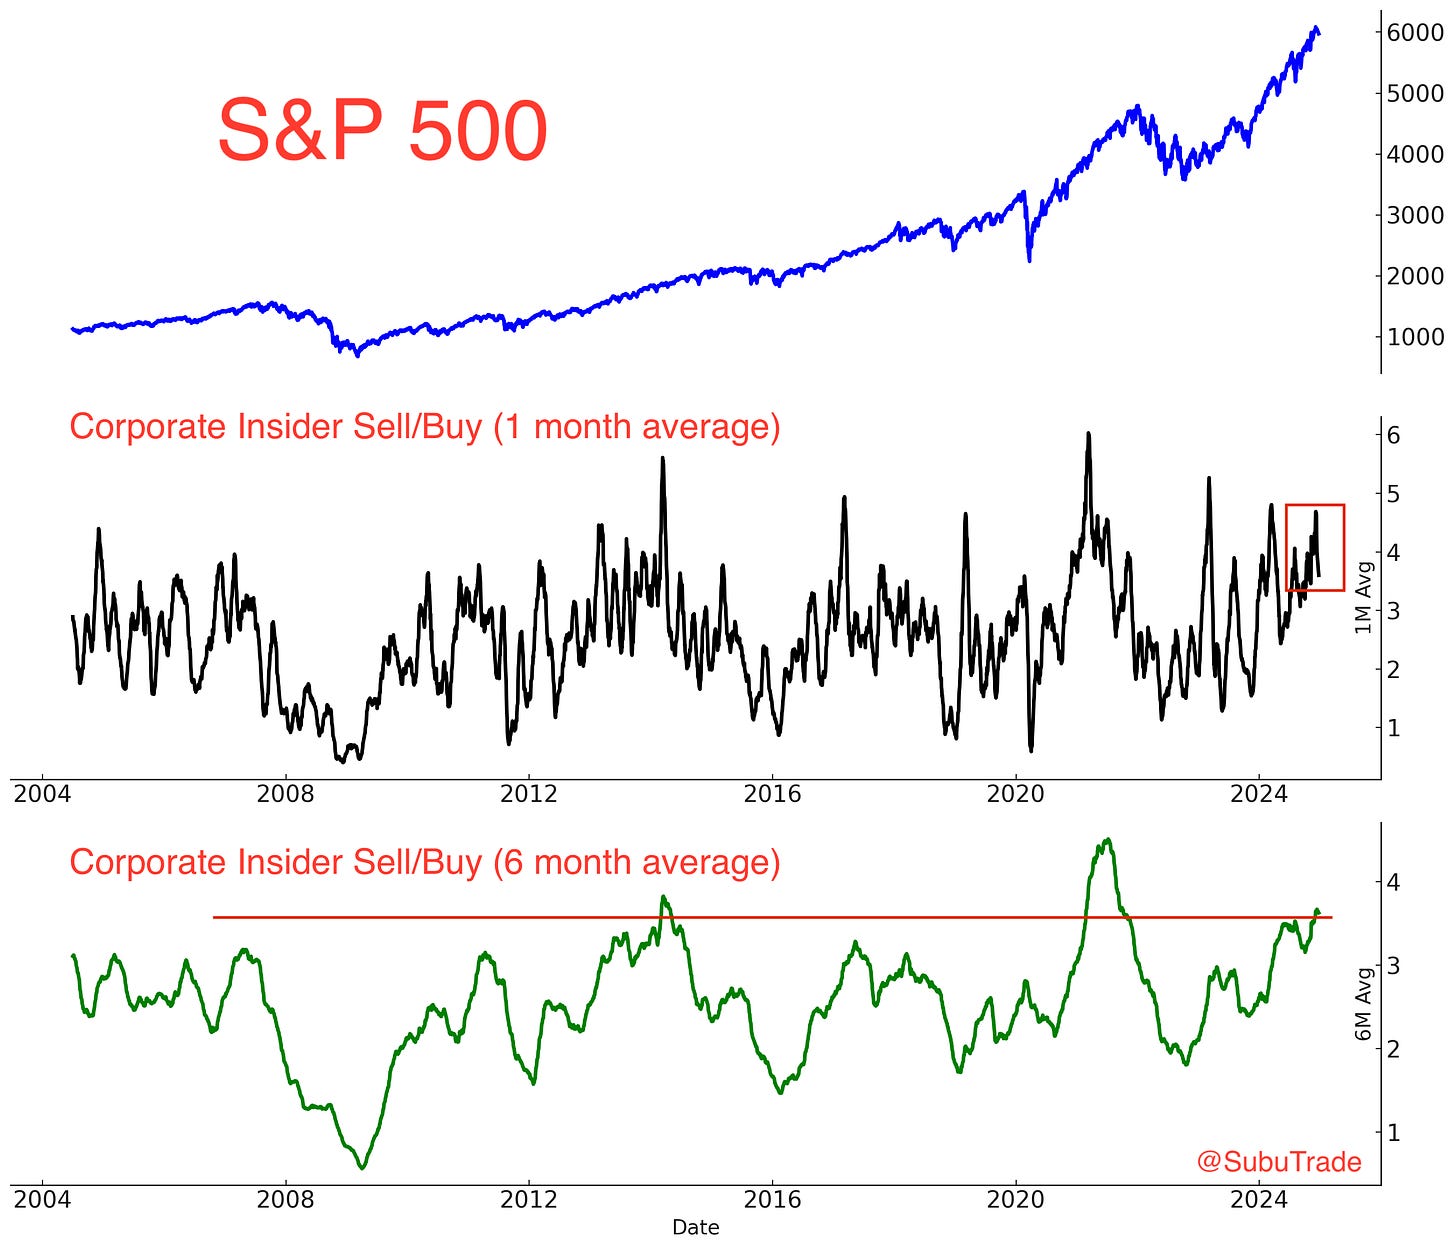
Corporate insiders reduced their selling during the recent stock market pullback. With that being said, overall sales have been incredibly high over the past 6 months, matched only by 2014 and 2020. This is a long term bearish factor:
Commitment of Traders Report (COT)
According to the COT Report, Asset Managers are still near record long for the S&P 500 e-mini futures:
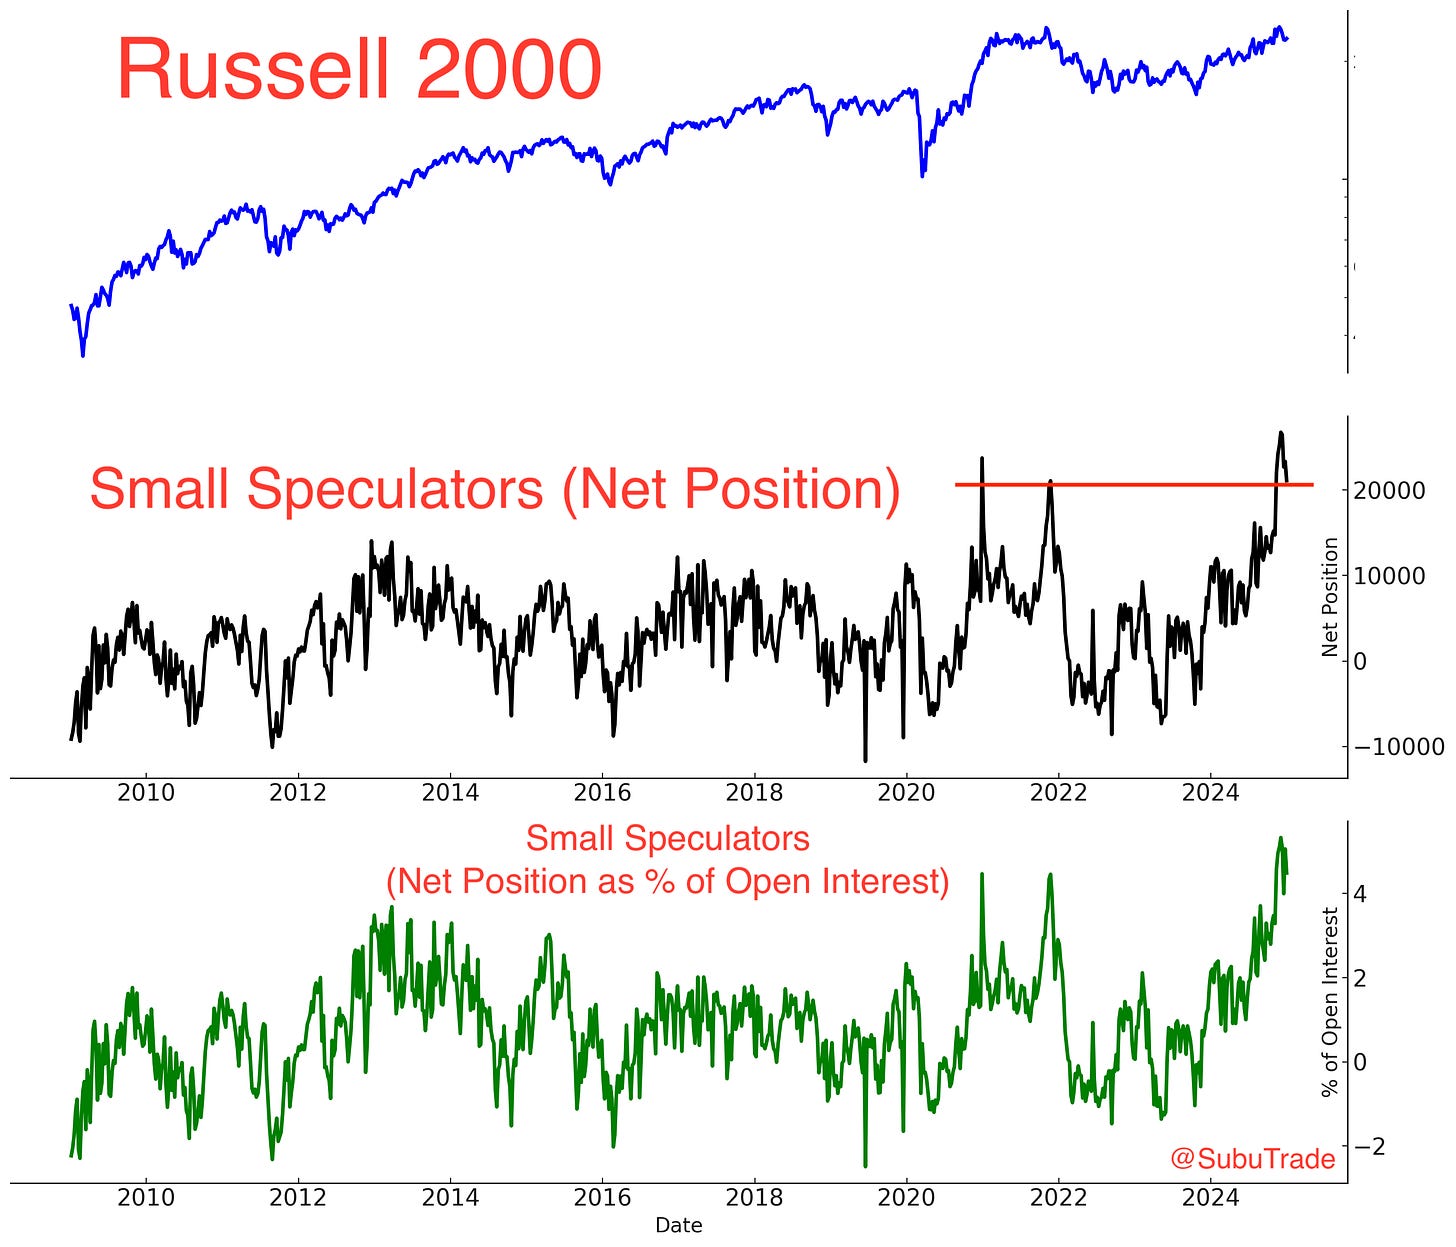
Similarly, Small Speculators are near record long for the Russell 2000 e-mini futures. Such bullishness was only matched by the 2020-2021 COVID bull run. These are long term bearish factors:
Sentiment
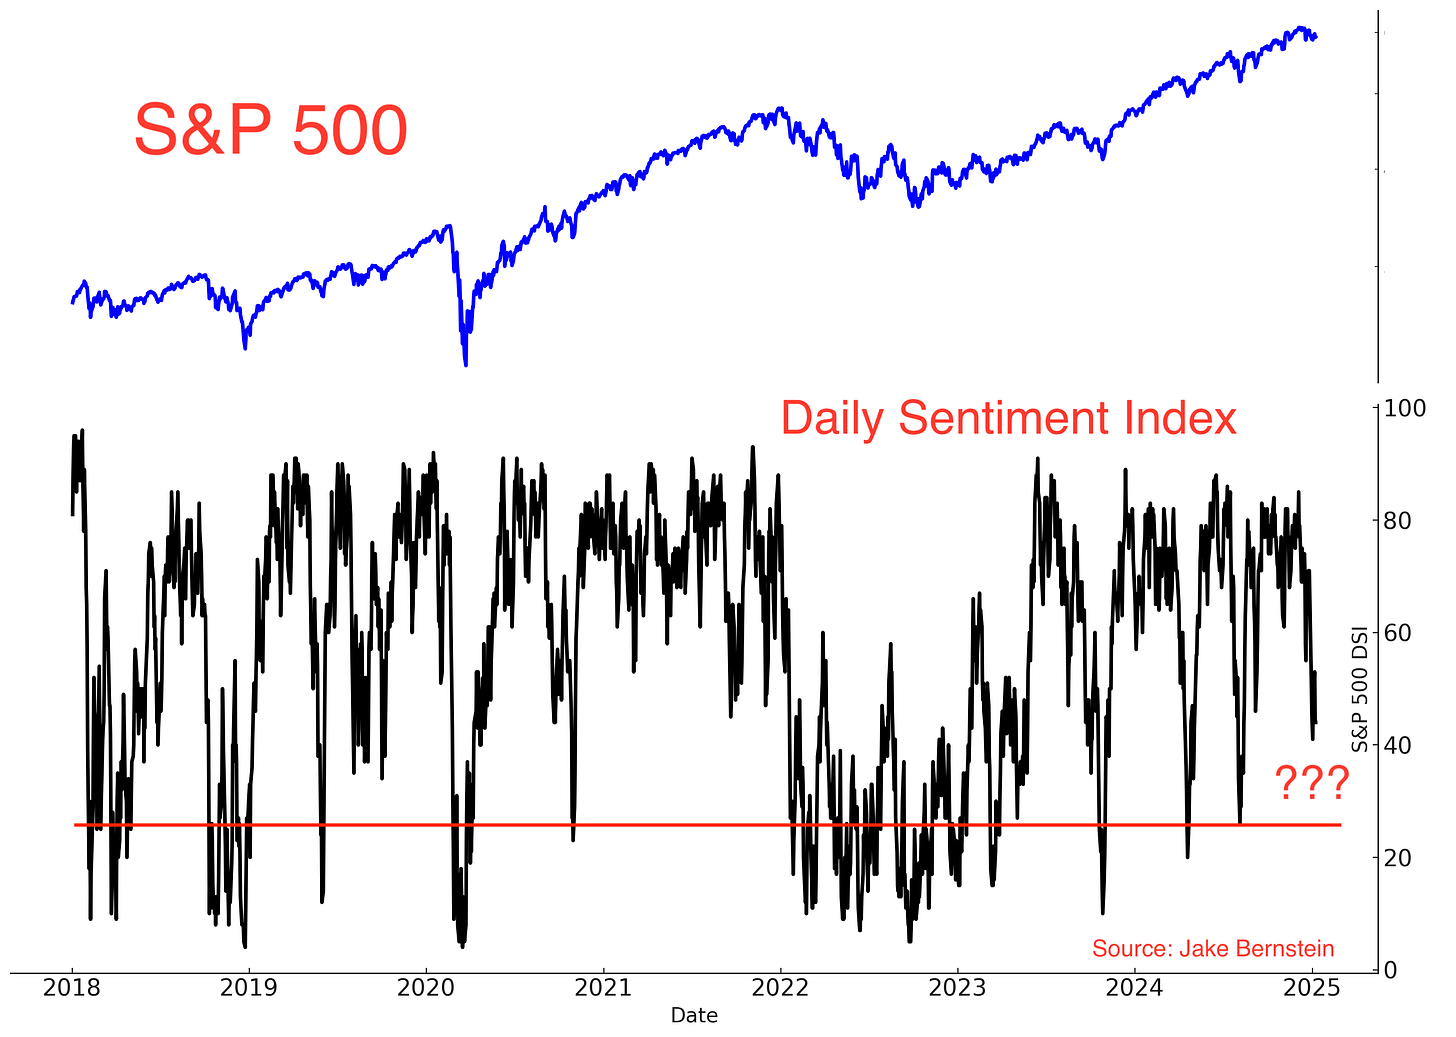
The recent pullback has not been enough to bring down the S&P 500’s Daily Sentiment Index. This is a medium term neutral factor which suggests that there hasn’t been enough selling to definitively call for a bottom:
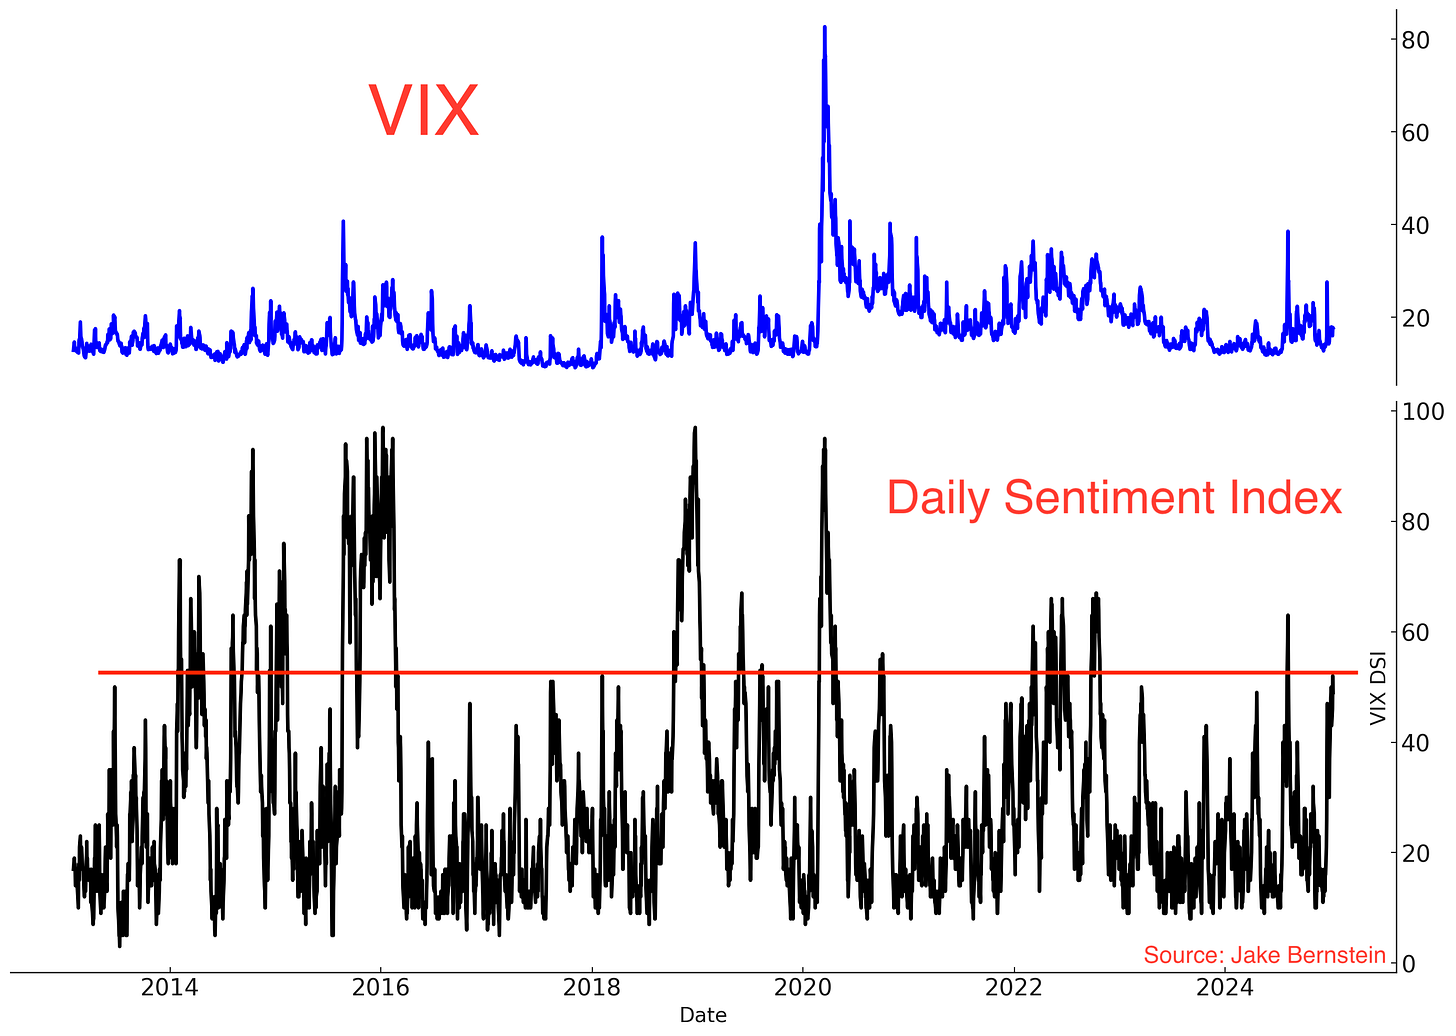
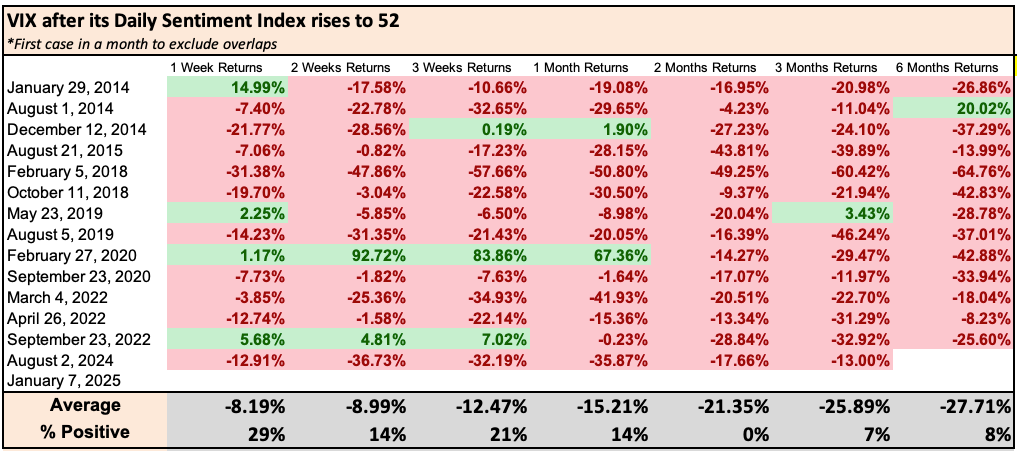
Opposite to the S&P 500, VIX’s Daily Sentiment Index has jumped to 52:
Since VIX is mean-reverting, VIX was lower 2 months later in similar historical cases:
It is entirely possible for the S&P 500 to make new lows, while VIX does not make a new high.
Breadth
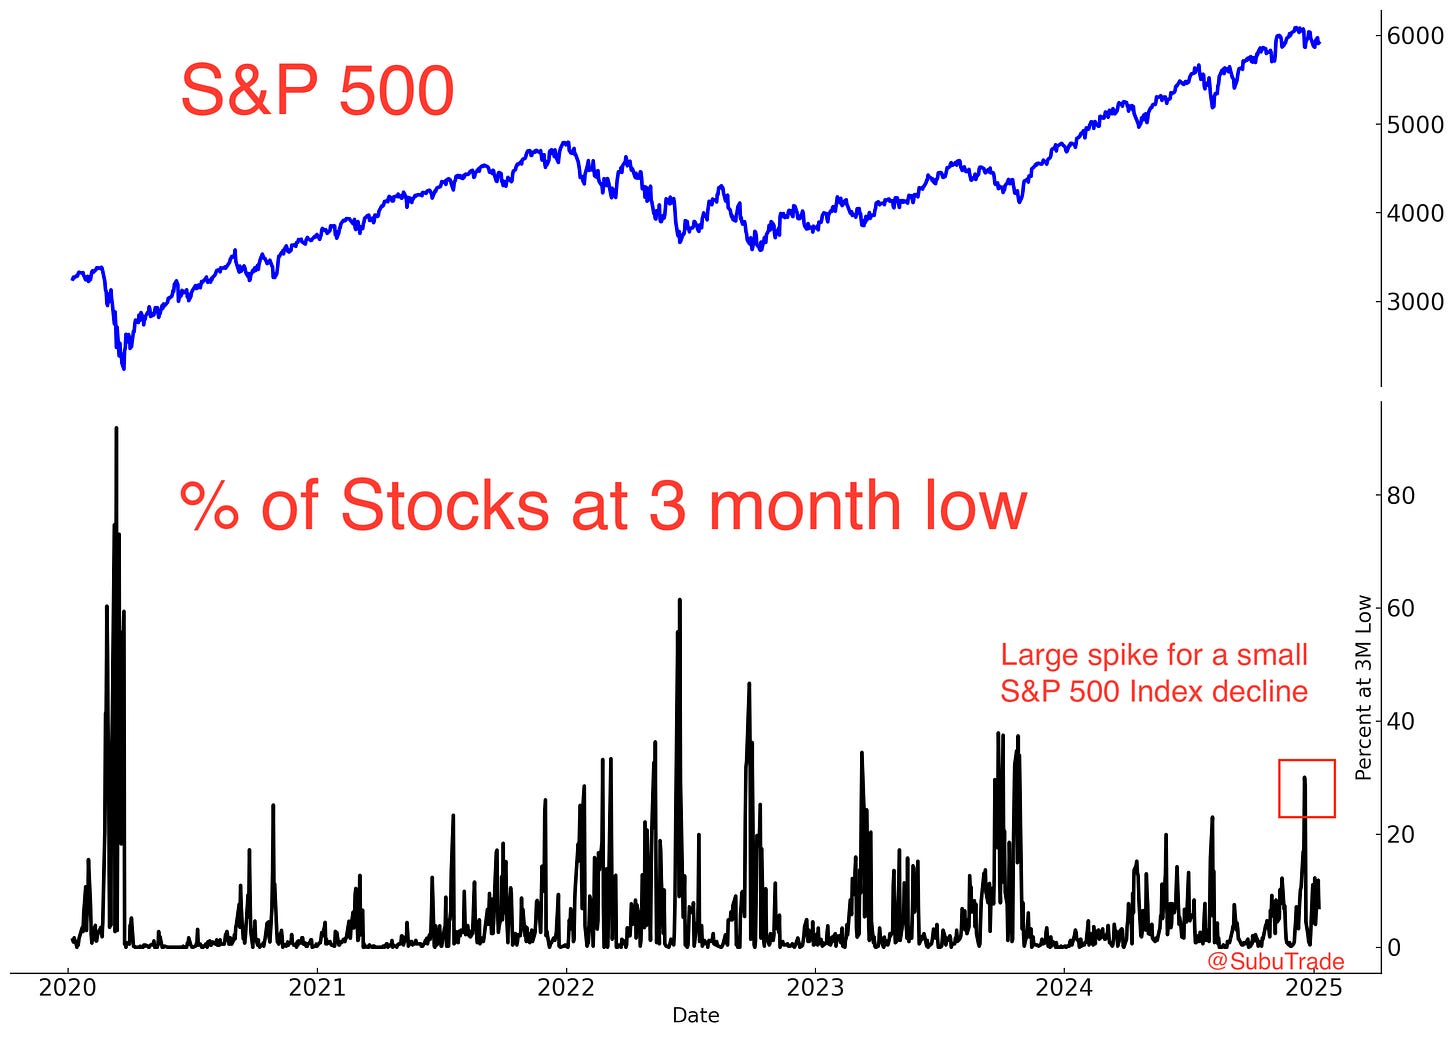
Breadth remains weak. This chart shows the % of S&P 500 stocks at a 3 month low:
This breadth figure is much higher than where it was during the August 2024 stock market pullback, despite the S&P 500 Index’s recent pullback being smaller than that of August 2024.
This clearly illustrates that while a few large cap stocks remain near all-time highs and hold up the Index, many of the index’s smaller stocks have already fallen.
Bonds
The bond market selloff continues. There is a fear that Trump’s trade war policies will be inflationary, which will push interest rates up and bond prices down. Overall, I do not expect bond prices to trend strongly as they did in 2022 (strong downtrend) or 2019-2020 (strong uptrend). I expect bonds to mostly swing sideways within a range.
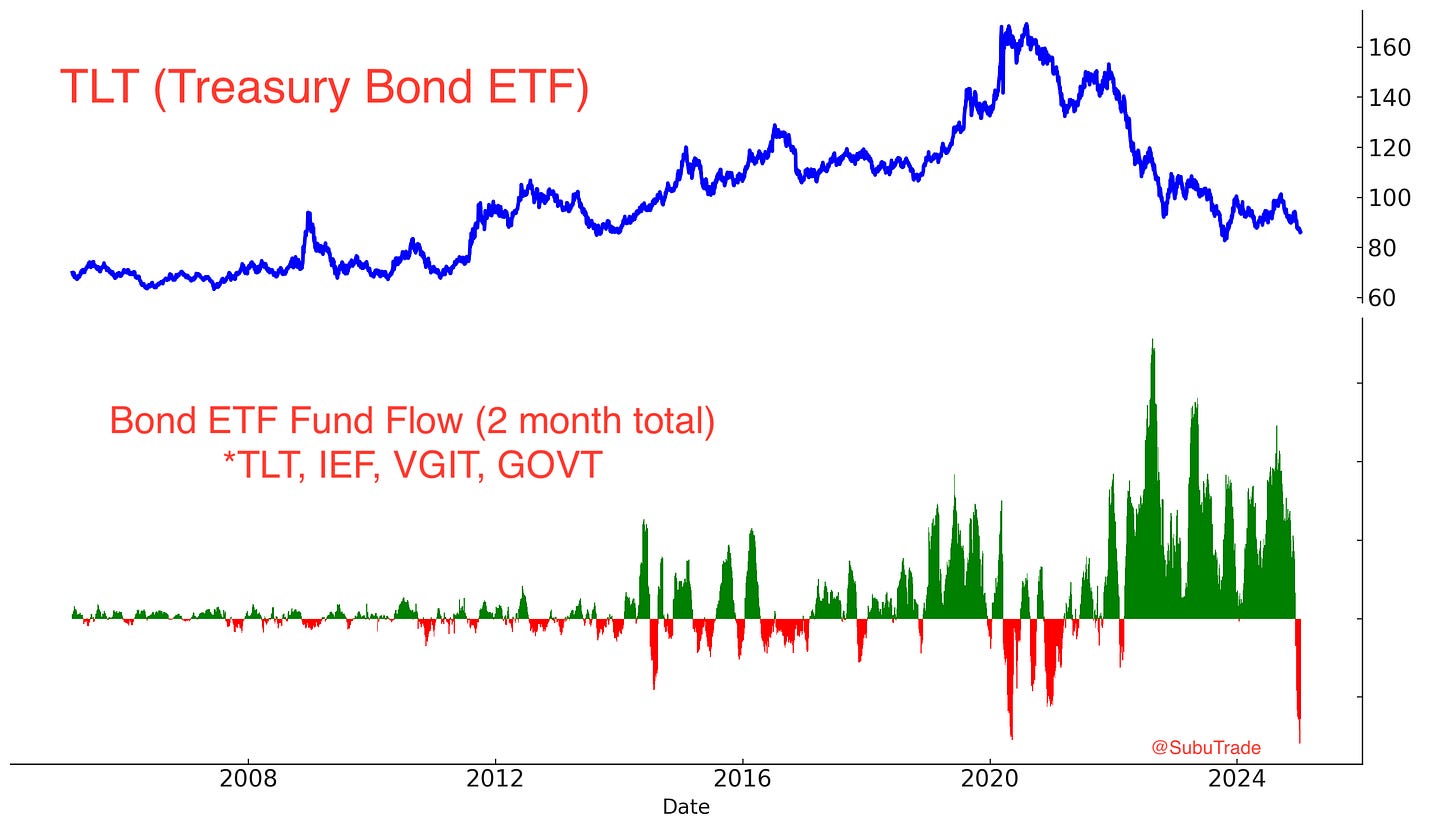
With that being said, there have been record outflows from major bond ETFs. This is a medium term bullish factor for bonds:
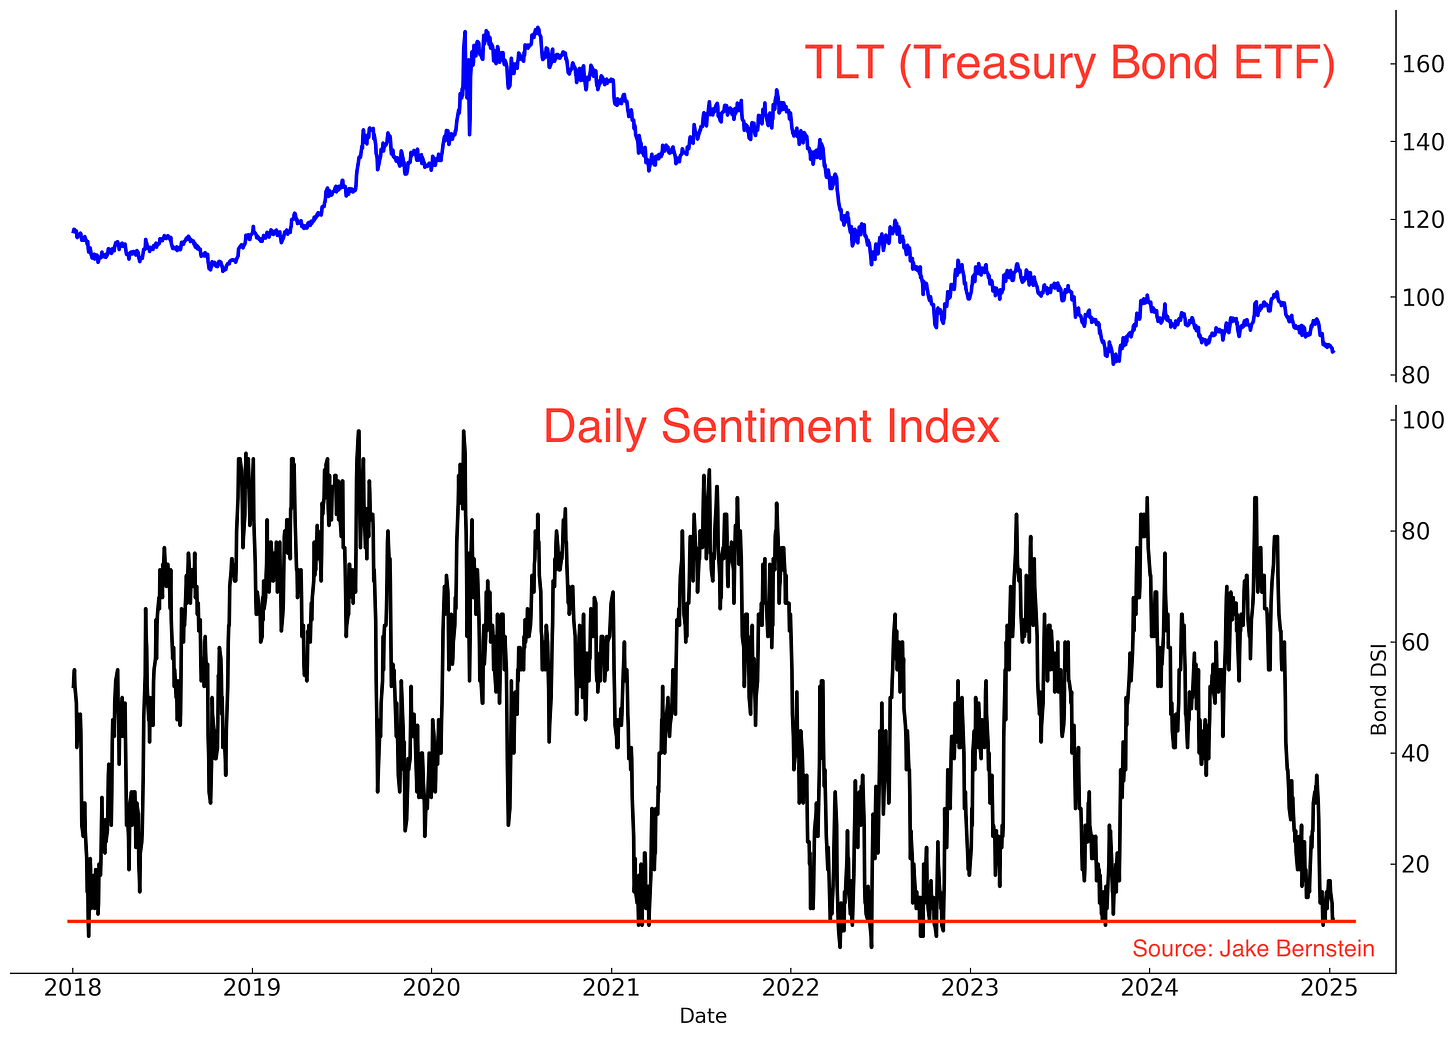
Similarly, sentiment is depressed:
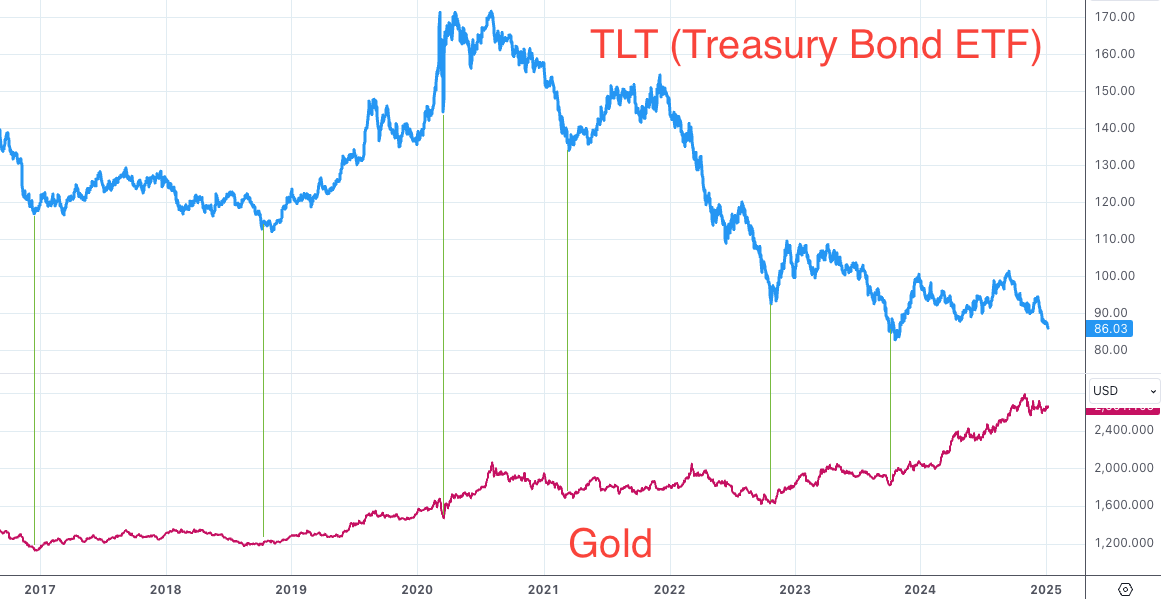
If bonds stop falling, gold will probably rally. While bonds and gold don’t necessarily move in the same direction, their cycle lows have been the same over the past decade. Gold’s price action has been exemplar: despite pressure from bonds, gold has merely consolidated sideways:
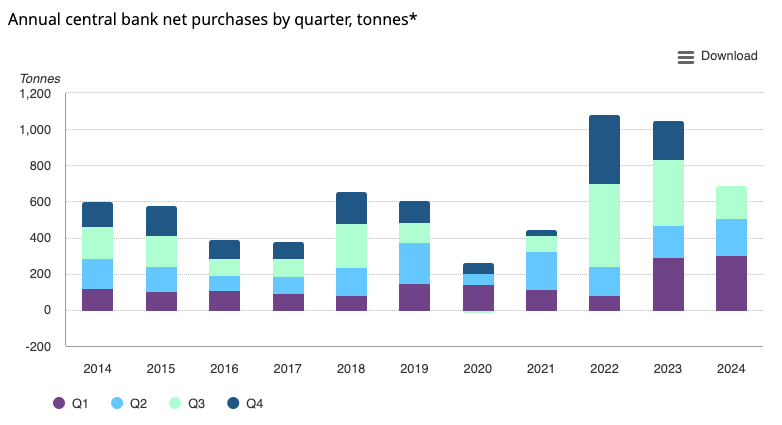
The rally in gold has a strong macro reason: central banks (China and Russia) are buying:
Chinese buying will probably increase as the U.S.-China trade war escalates. China must diversify its U.S. Treasury holdings into something that cannot be confiscated by the U.S. (i.e. gold).
Commodities
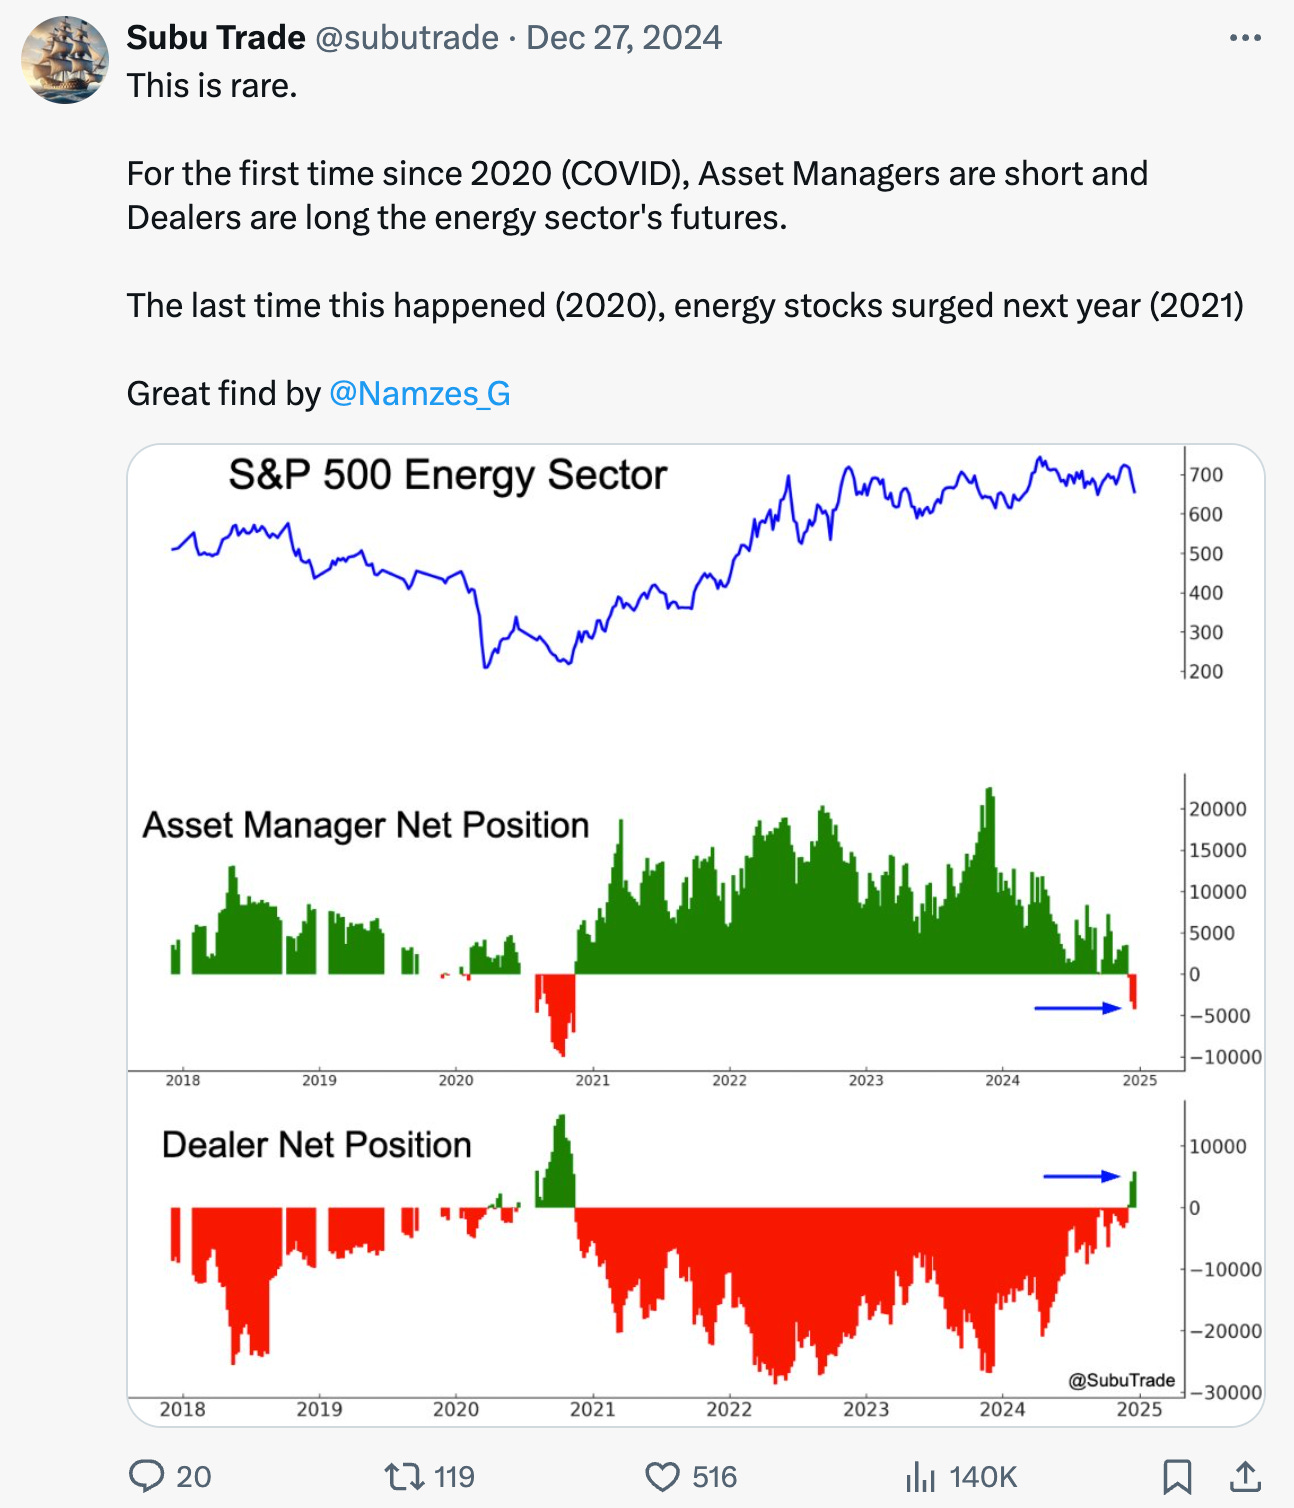
Investors and traders are quite bearish towards the energy sector. I noted 2 important things on X/Twitter during the Christmas holidays. Here’s COT positioning for the S&P 500 Energy sector:
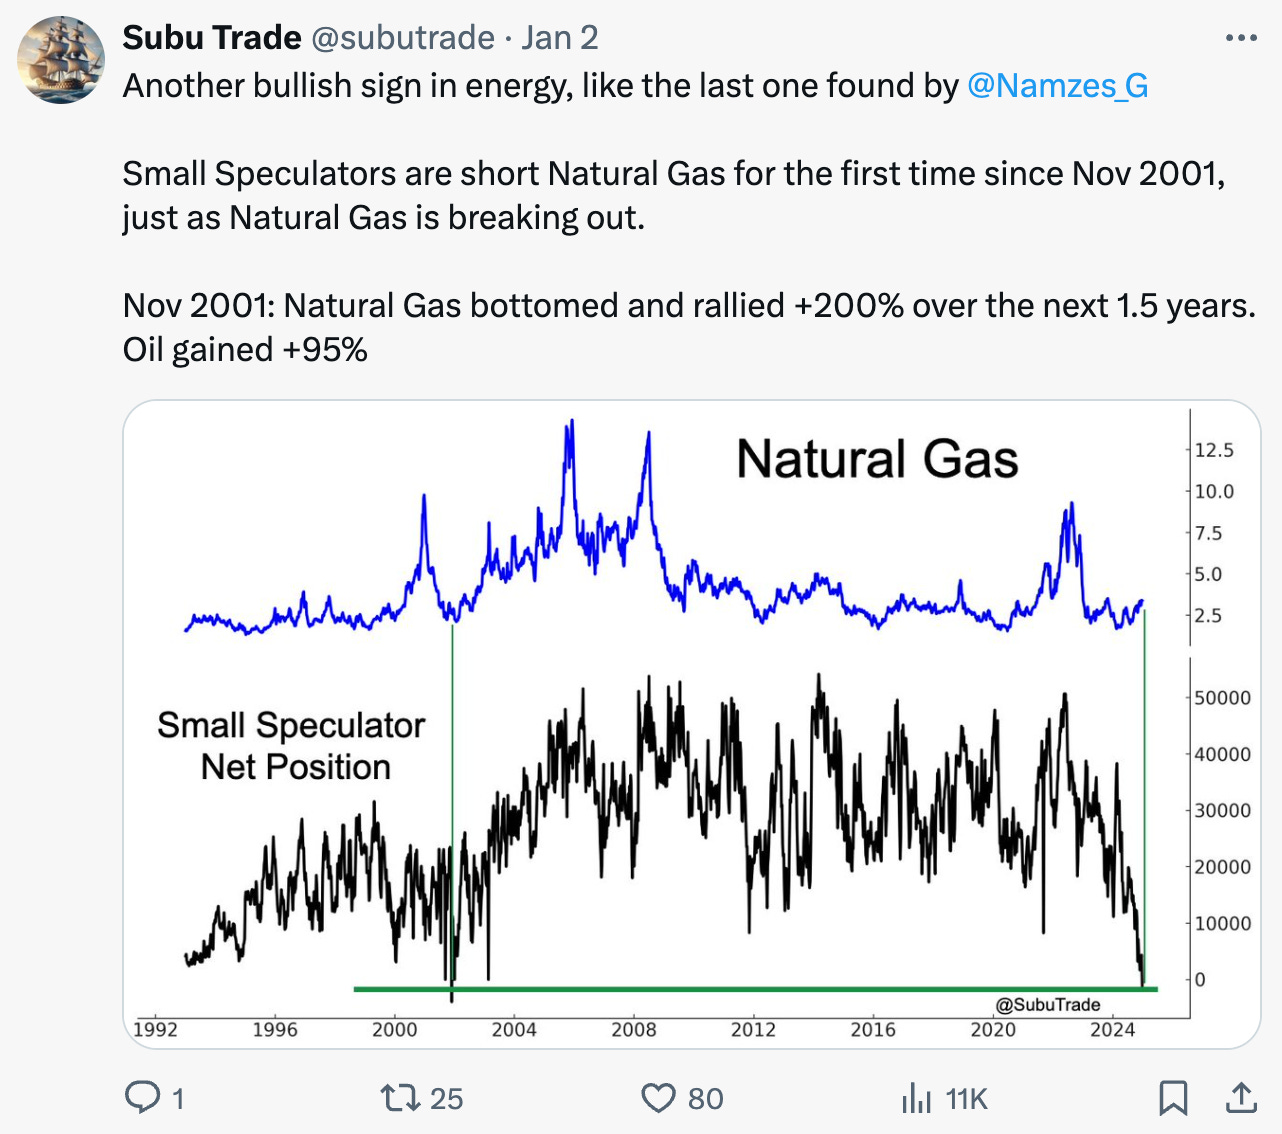
And here’s COT positioning for Natural Gas:
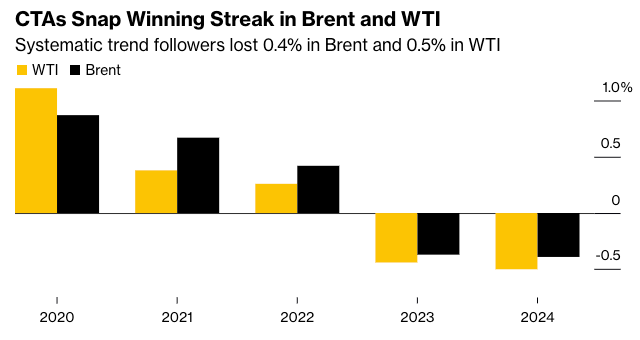
Bloomberg just published another interesting article:
Trading strategies, like markets themselves, go through cycles. If a strategy like trend following goes through a 2 year rough patch, the next year will probably outperform. This means that we might see energy markets trend strongly in 2025. Energy prices up??
India
I am extremely long term bullish towards India: I believe that this is the Indian Century. Moreover, the U.S.-China economic war will not stop until one side is defeated, and in all likelihood, the U.S. and its allies will defeat China.
*Biggest winner from the U.S.-China economic war is India.
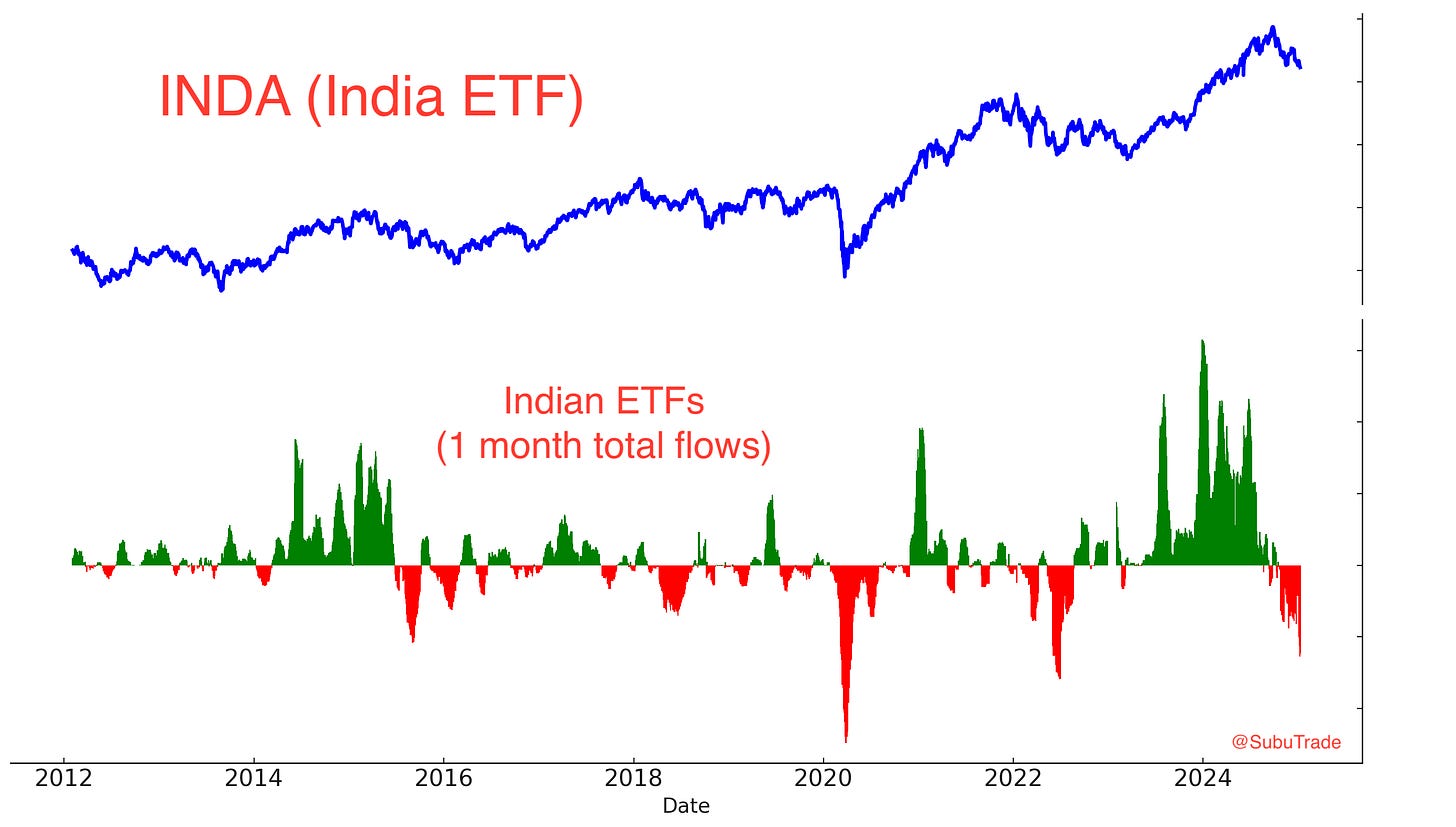
Indian equities have been under pressure recently, with GDP growth slowing a little and the U.S. Dollar rising. As a result, foreign investors and traders are now rushing out of Indian ETFs. This is a medium term bullish factor for Indian stocks:
If the U.S. stock market sells off even more, Indian stocks will fall even more. That will be a terrific buying opportunity.
Conclusion & how I’m positioned
Here’s how I’m incorporating my market analysis into my trading:
I remain long U.S. equities, but significantly underweight. This is my core-trend following positioning.
I have purchased some deep out-of-the-money SPY puts as crash protection. I am not predicting a stock market crash. This is a small position that is solely intended to safeguard against a potential stock market crash in 2025.
I have 2 small long positions in TLT (Treasury bonds) and XLE (energy stocks). These are non-core contrarian positions that I intend to hold for a few weeks/months.
I am long Chinese equities using calls on Chinese ETFs. This is a very small position, which I explained in my previous market report.
Happy New Year! If you have any questions, feel free to email me or leave a comment!






A great read as always, thanks for the insights!
great job