


Markets Report: the "Everything Else" rally
US equities swing sideways while other markets push higher.

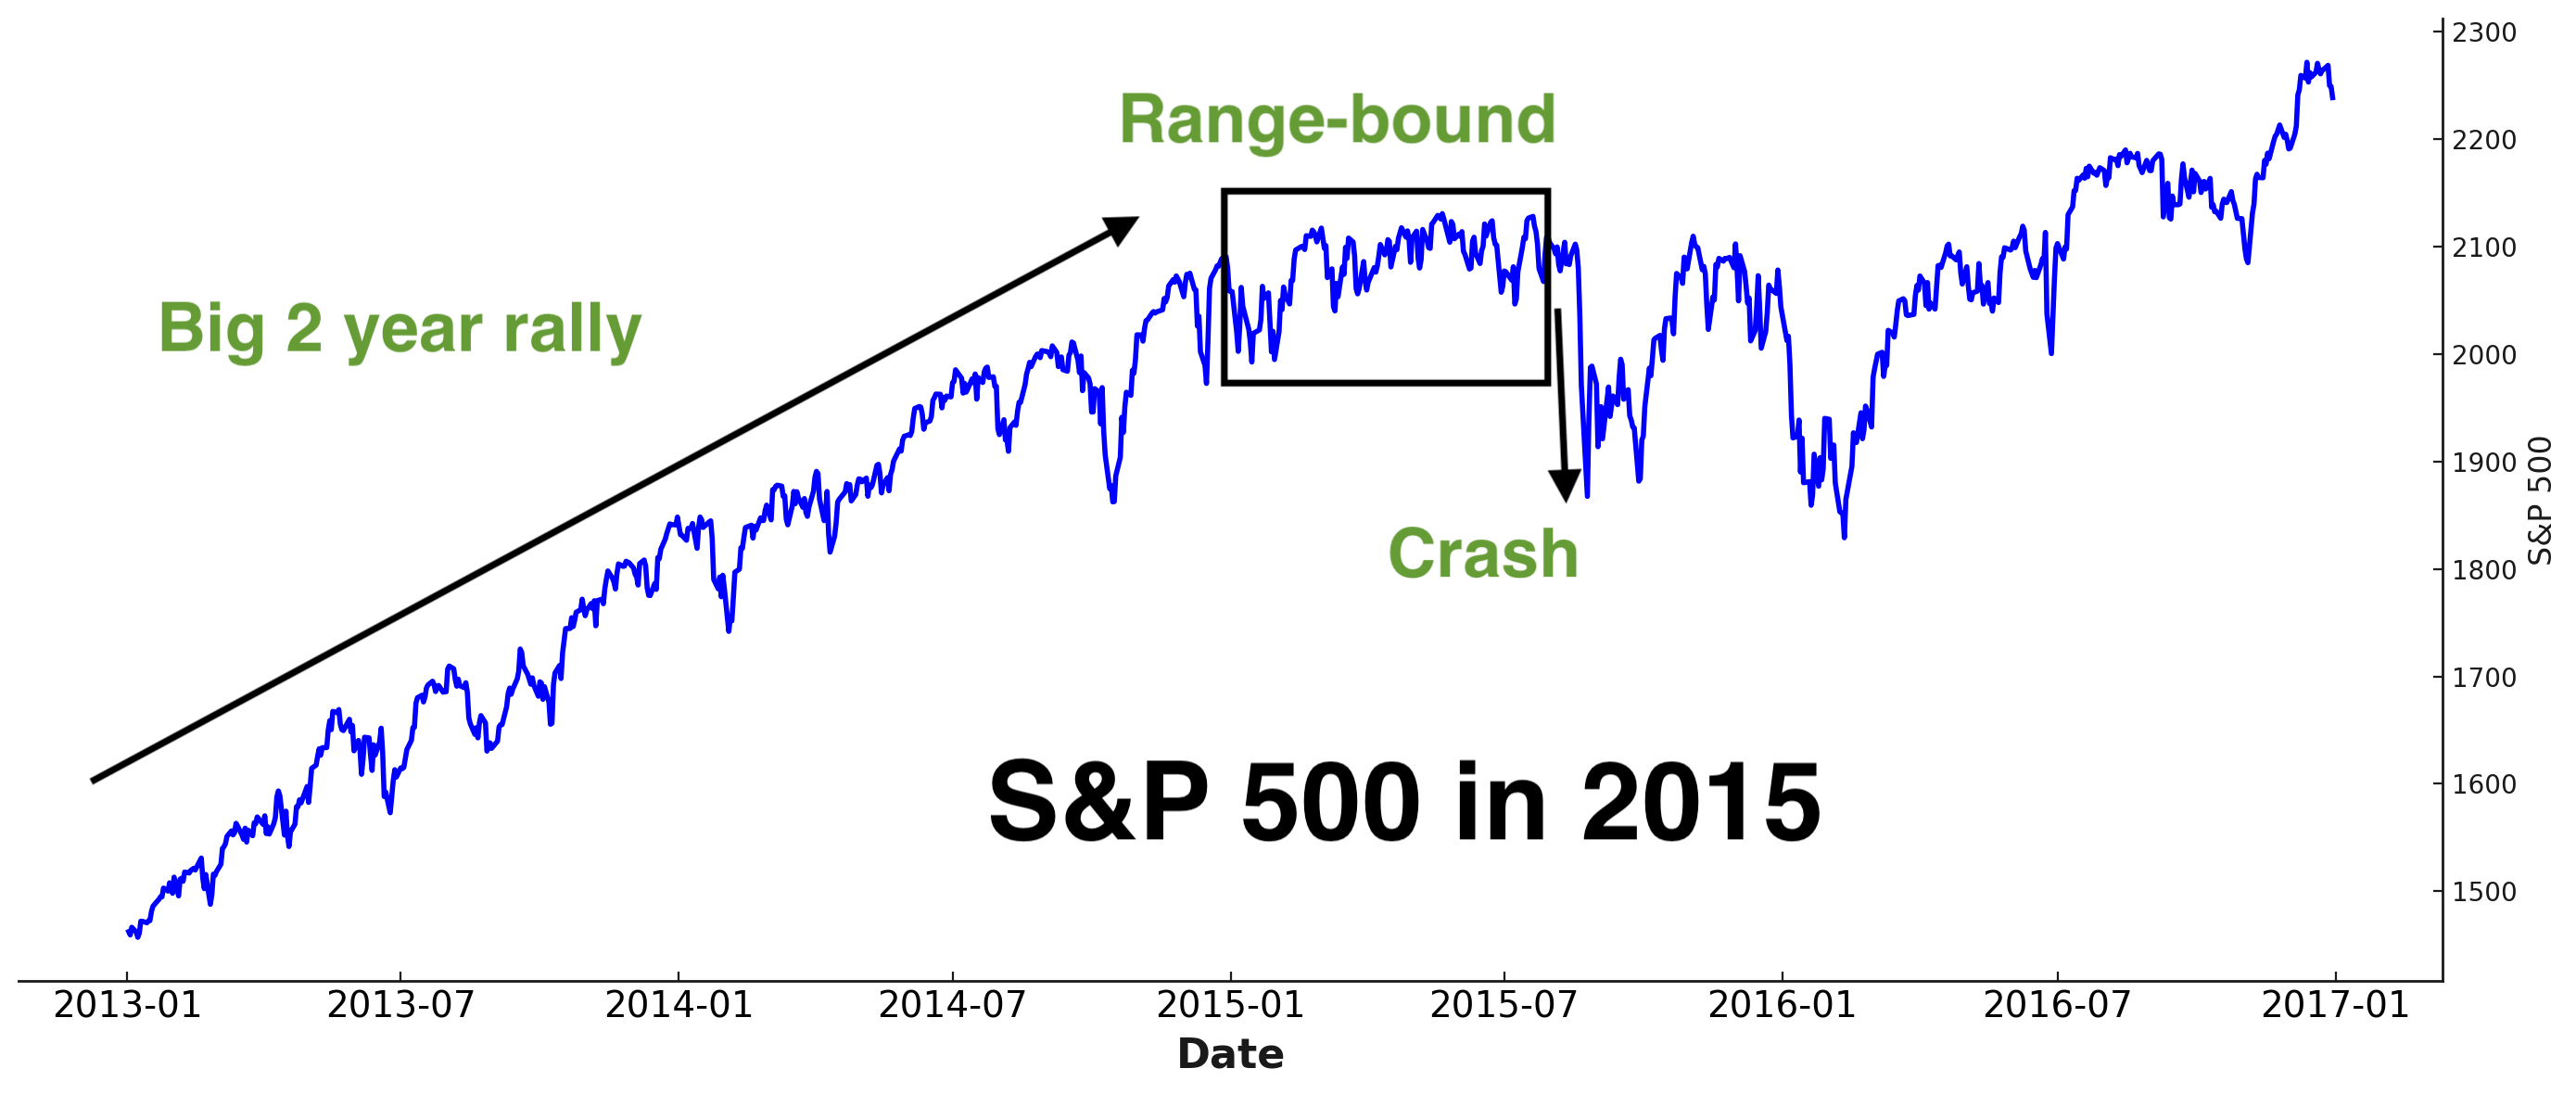
As expected, the U.S. stock market today continues to follow a pattern reminiscent of 2015:
A massive two-year rally (2013-2014 and 2023-2024).
A period of consolidation and sideways movement (early 2015).
A subsequent market downturn (August 2015).
While U.S. equities remain range-bound, significant trends are emerging across other markets.
Today’s Markets Report:
U.S. Equities: Consolidating as expected, with long-term concerns for 2025 still in focus. As long as the U.S. stock market avoids a major correction, other markets have room to maneuver.
Chinese Equities: Gaining momentum after years of underperformance. Still vulnerable to potential setbacks from the escalating U.S.-China economic conflict.
Indian Equities: Positioned as a key beneficiary of the U.S.-China economic conflict.
Gold, Silver, and Miners: Trending higher while supported by a strong bullish narrative and increased demand for safe-haven assets.
Treasury Bonds: Rallying, though their performance lags behind non-U.S. equities and precious metals. Meanwhile, the U.S. Dollar is falling.
*All charts and data updated as of today.
U.S. Equities
My outlook remains unchanged: U.S. equities are likely to trade within a range, offering little momentum for either bulls or bears. At present, there is no strong catalyst to drive markets massively higher or lower.
Options Flow
The S&P 500 Options Flow Index remains in neutral territory. This short term indicator demonstrates that neither bulls nor bears have a clear short term edge right now:
From a longer term perspective, the CBOE’s Total Put/Call Ratio is still very low. This is a long term concern:
The SKEW Index, which essentially measures the probability of a stock market crash, is still extremely elevated:
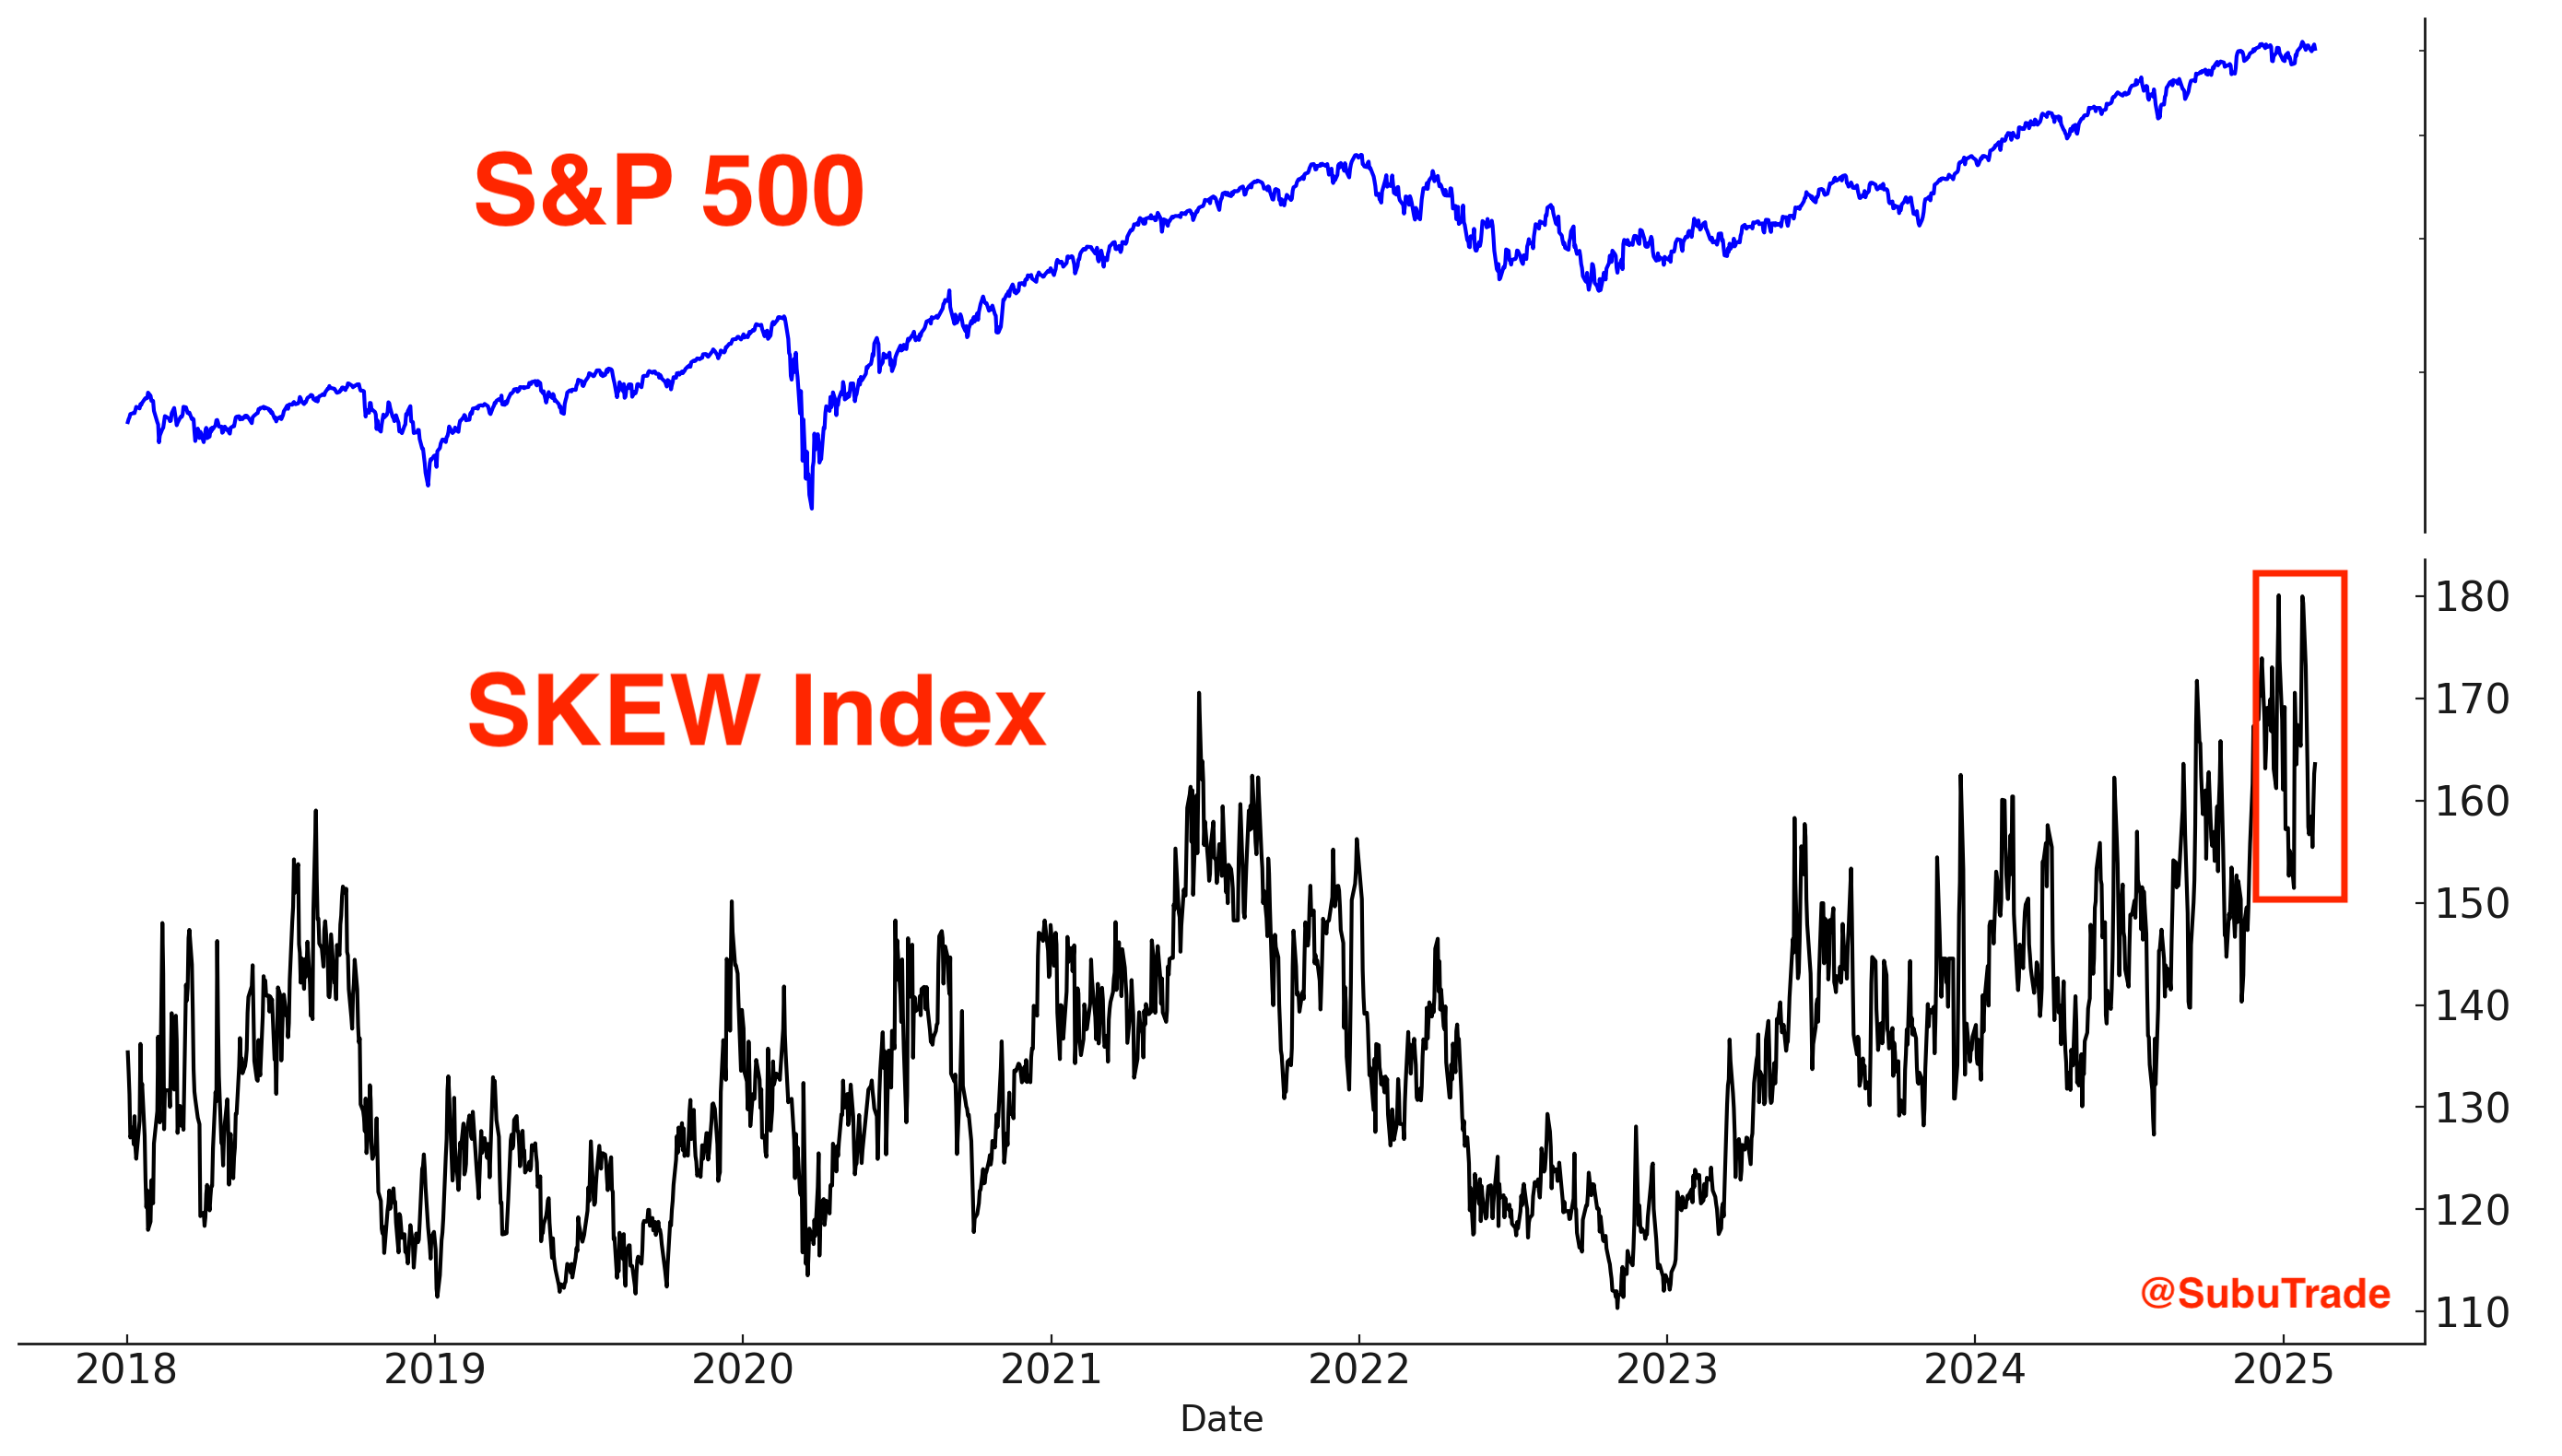
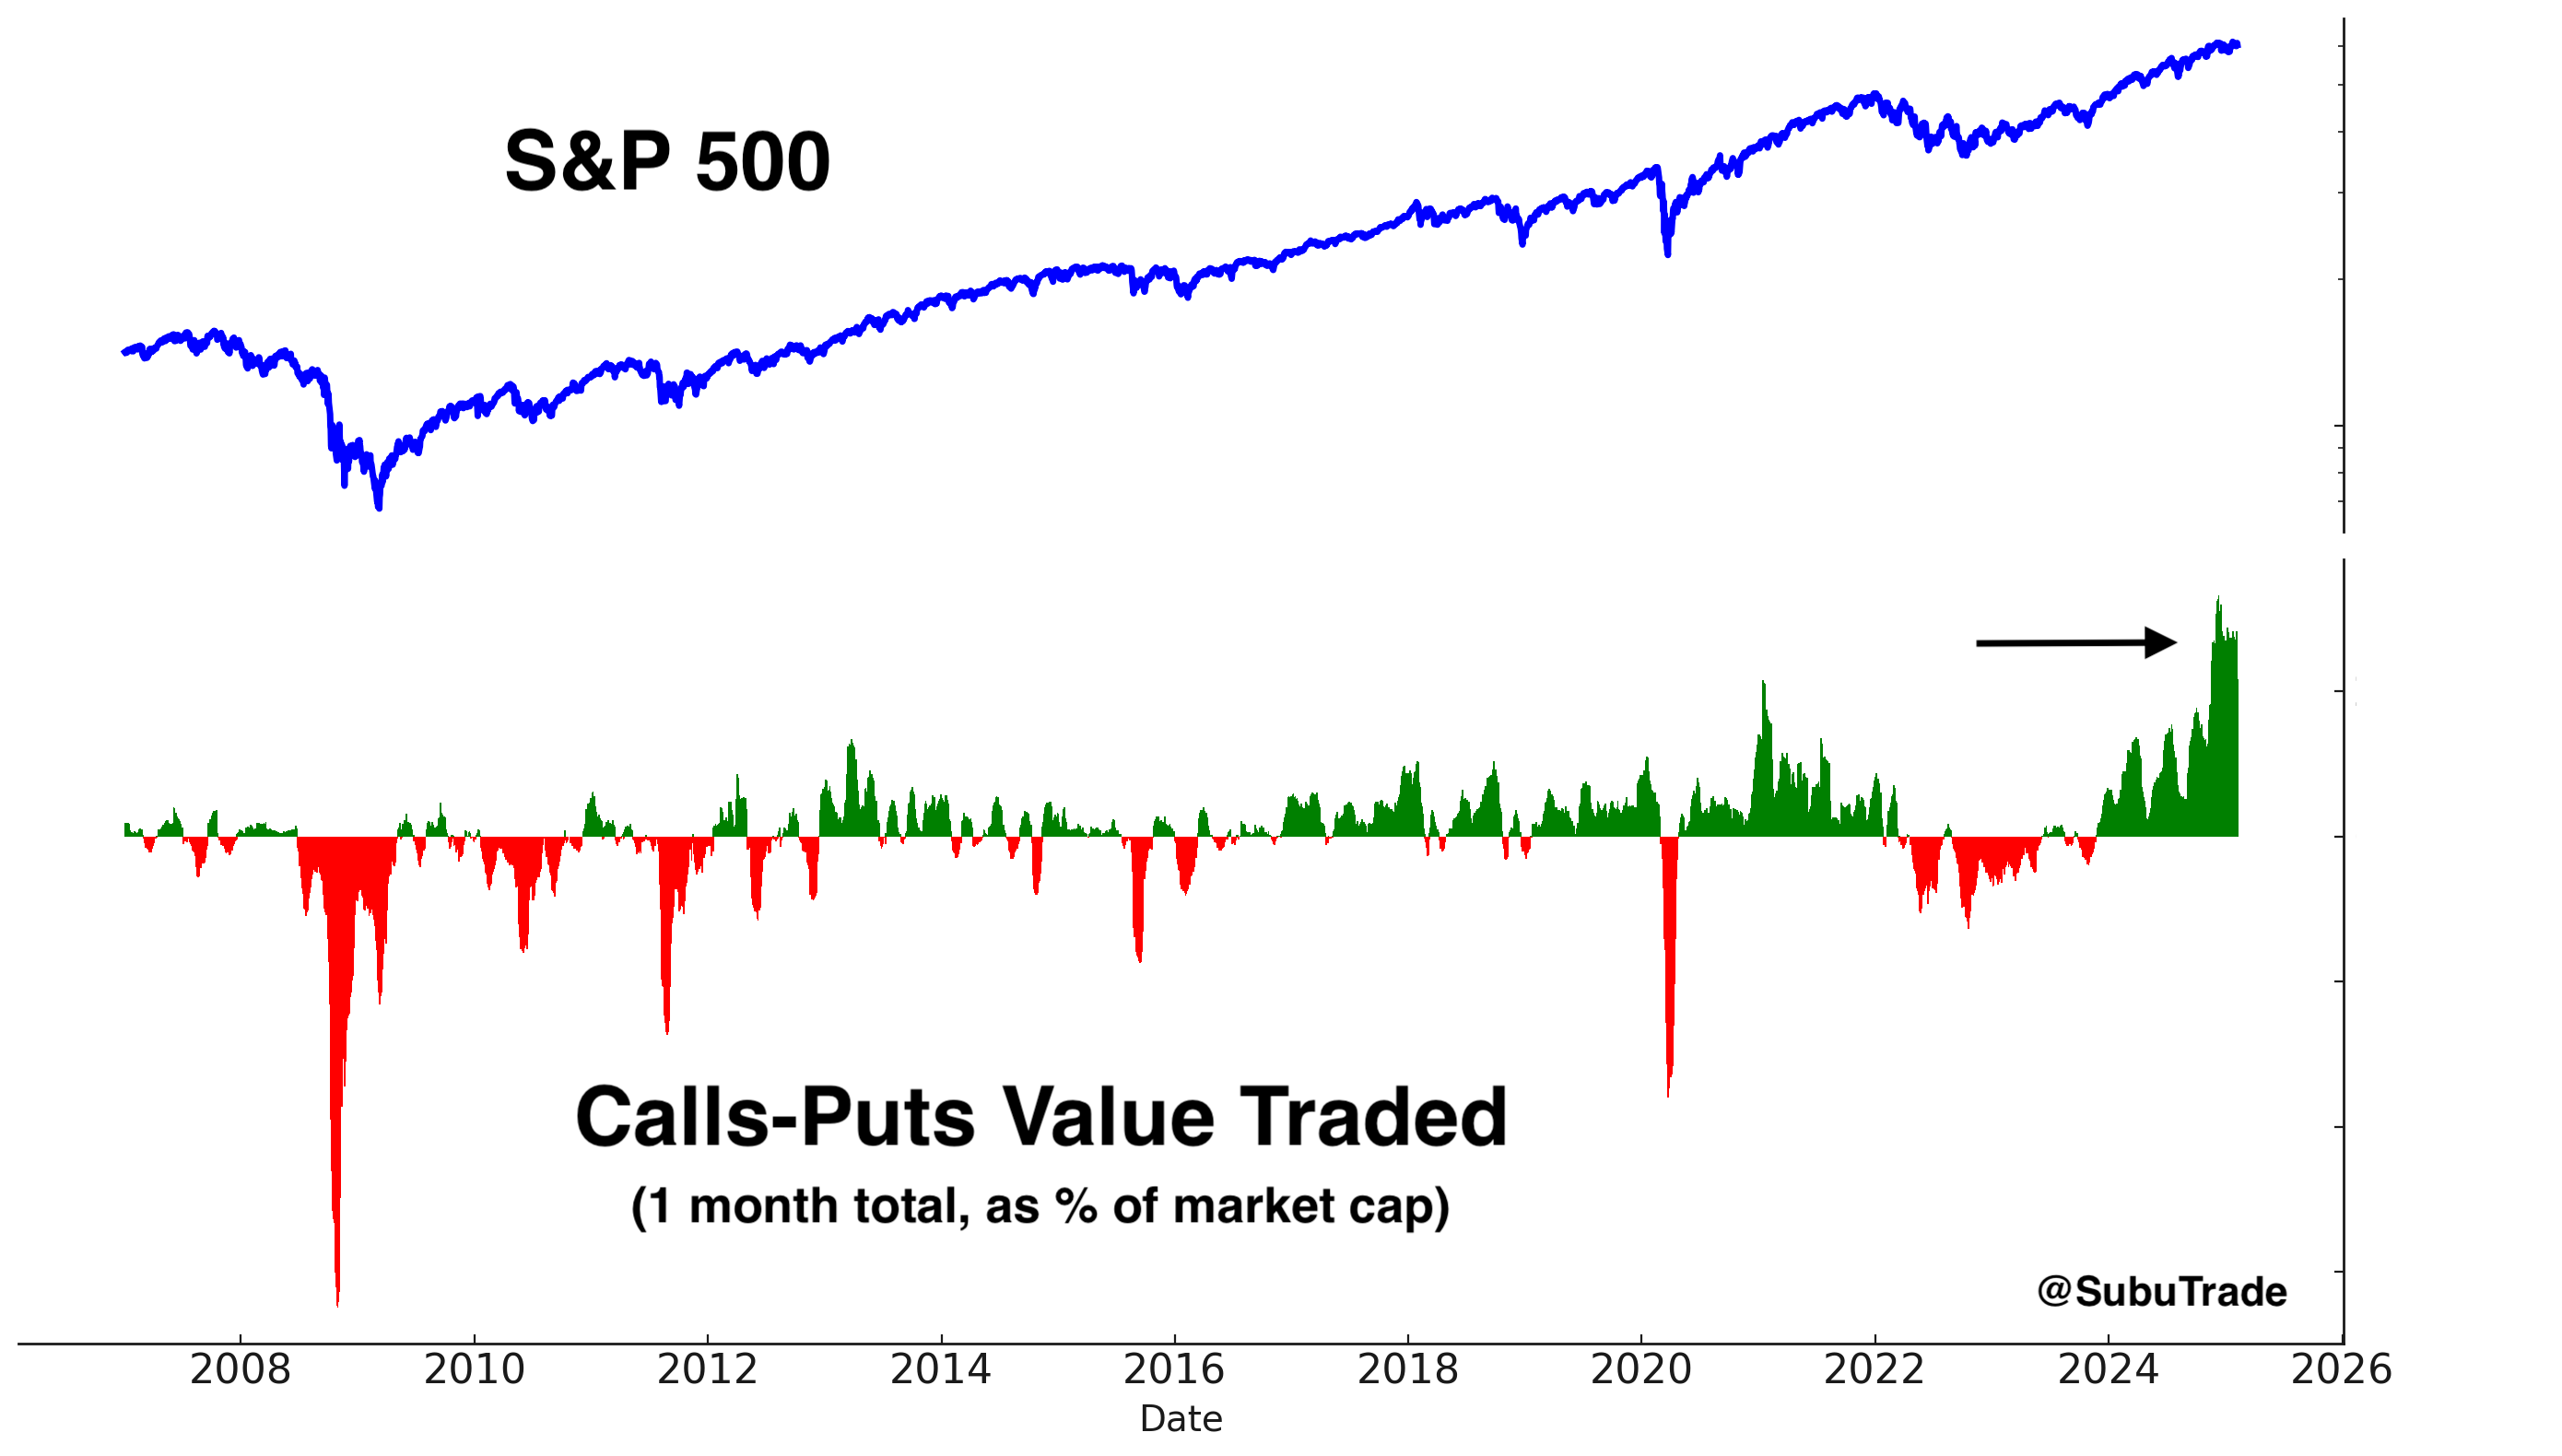
The value of Calls-Puts traded for the S&P 500 is still very high, but coming down a little. This warrants caution:
Sentiment
Sentiment remains in neutral territory. This is to be expected considering that the S&P 500 is essentially flat from where it was 2 months ago.
Here’s the S&P 500’s Daily Sentiment Index:
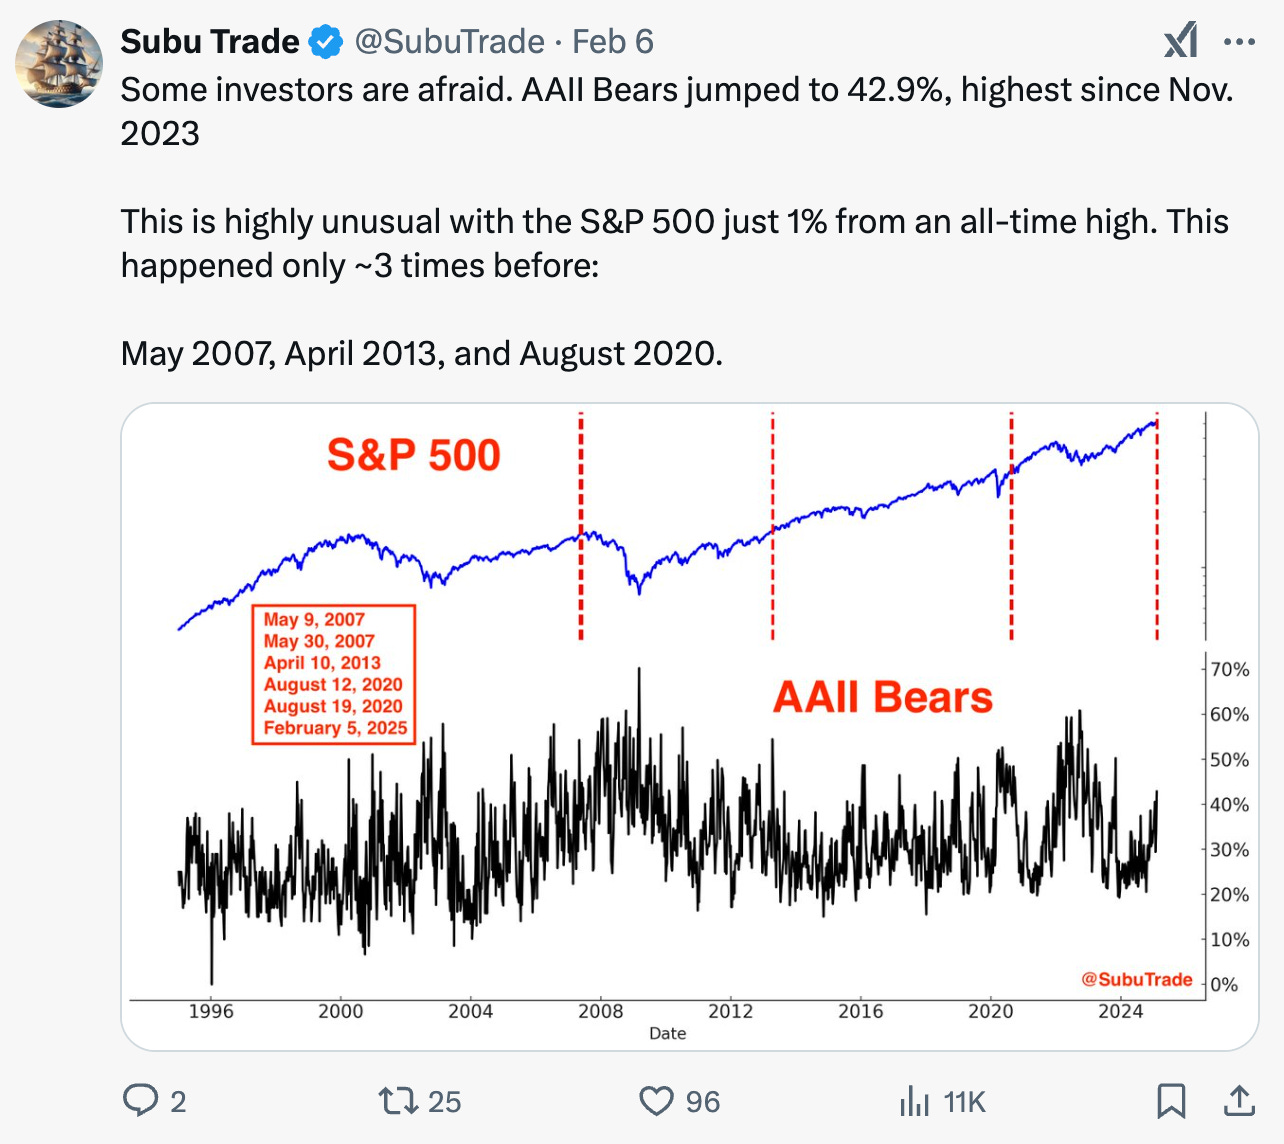
As I highlighted on Twitter/X, investor sentiment surveys indicate a rise in market anxiety. AAII Bears jumped to 42.9%, marking its highest level since November 2023. This is particularly notable given that the S&P 500 remains near an all-time high. Historically, such elevated bearish sentiment is typically observed when the S&P is trading at significantly lower levels.
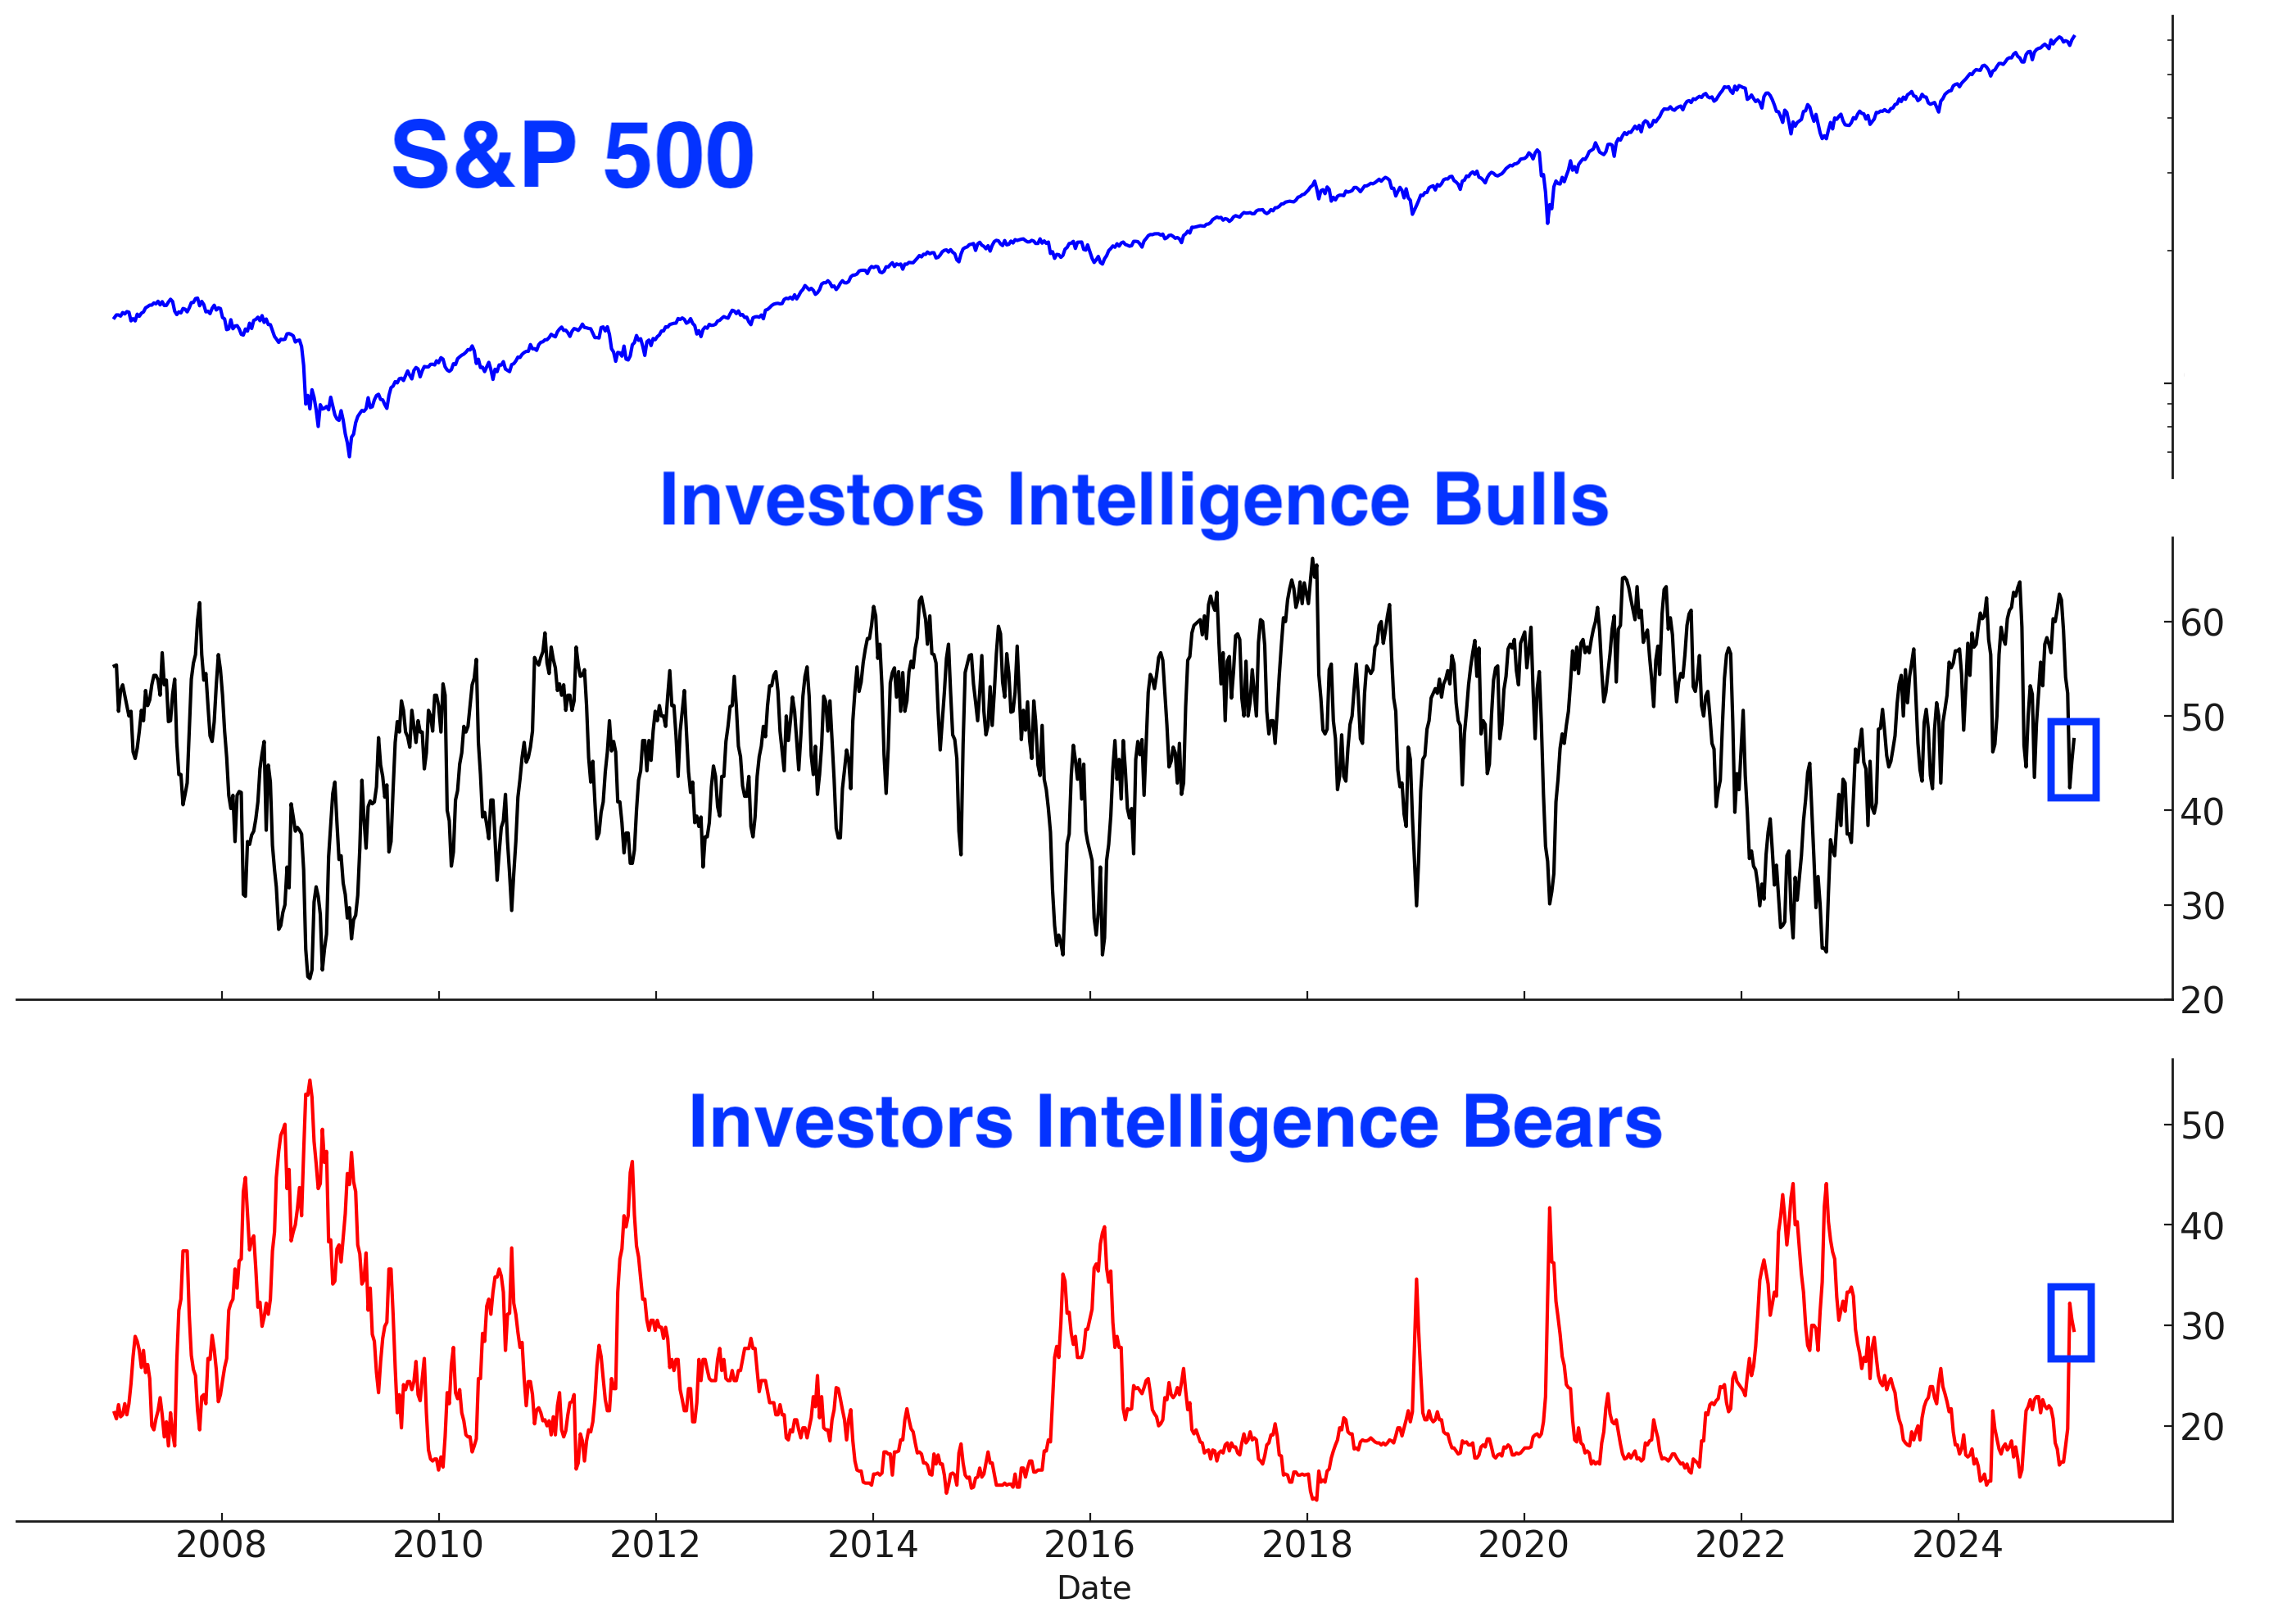
The Investors Intelligence Sentiment Survey reflects a similar level of anxiety. Bullish sentiment remains subdued, while bearish sentiment is elevated—an unexpected development given the S&P 500's proximity to an all-time high.
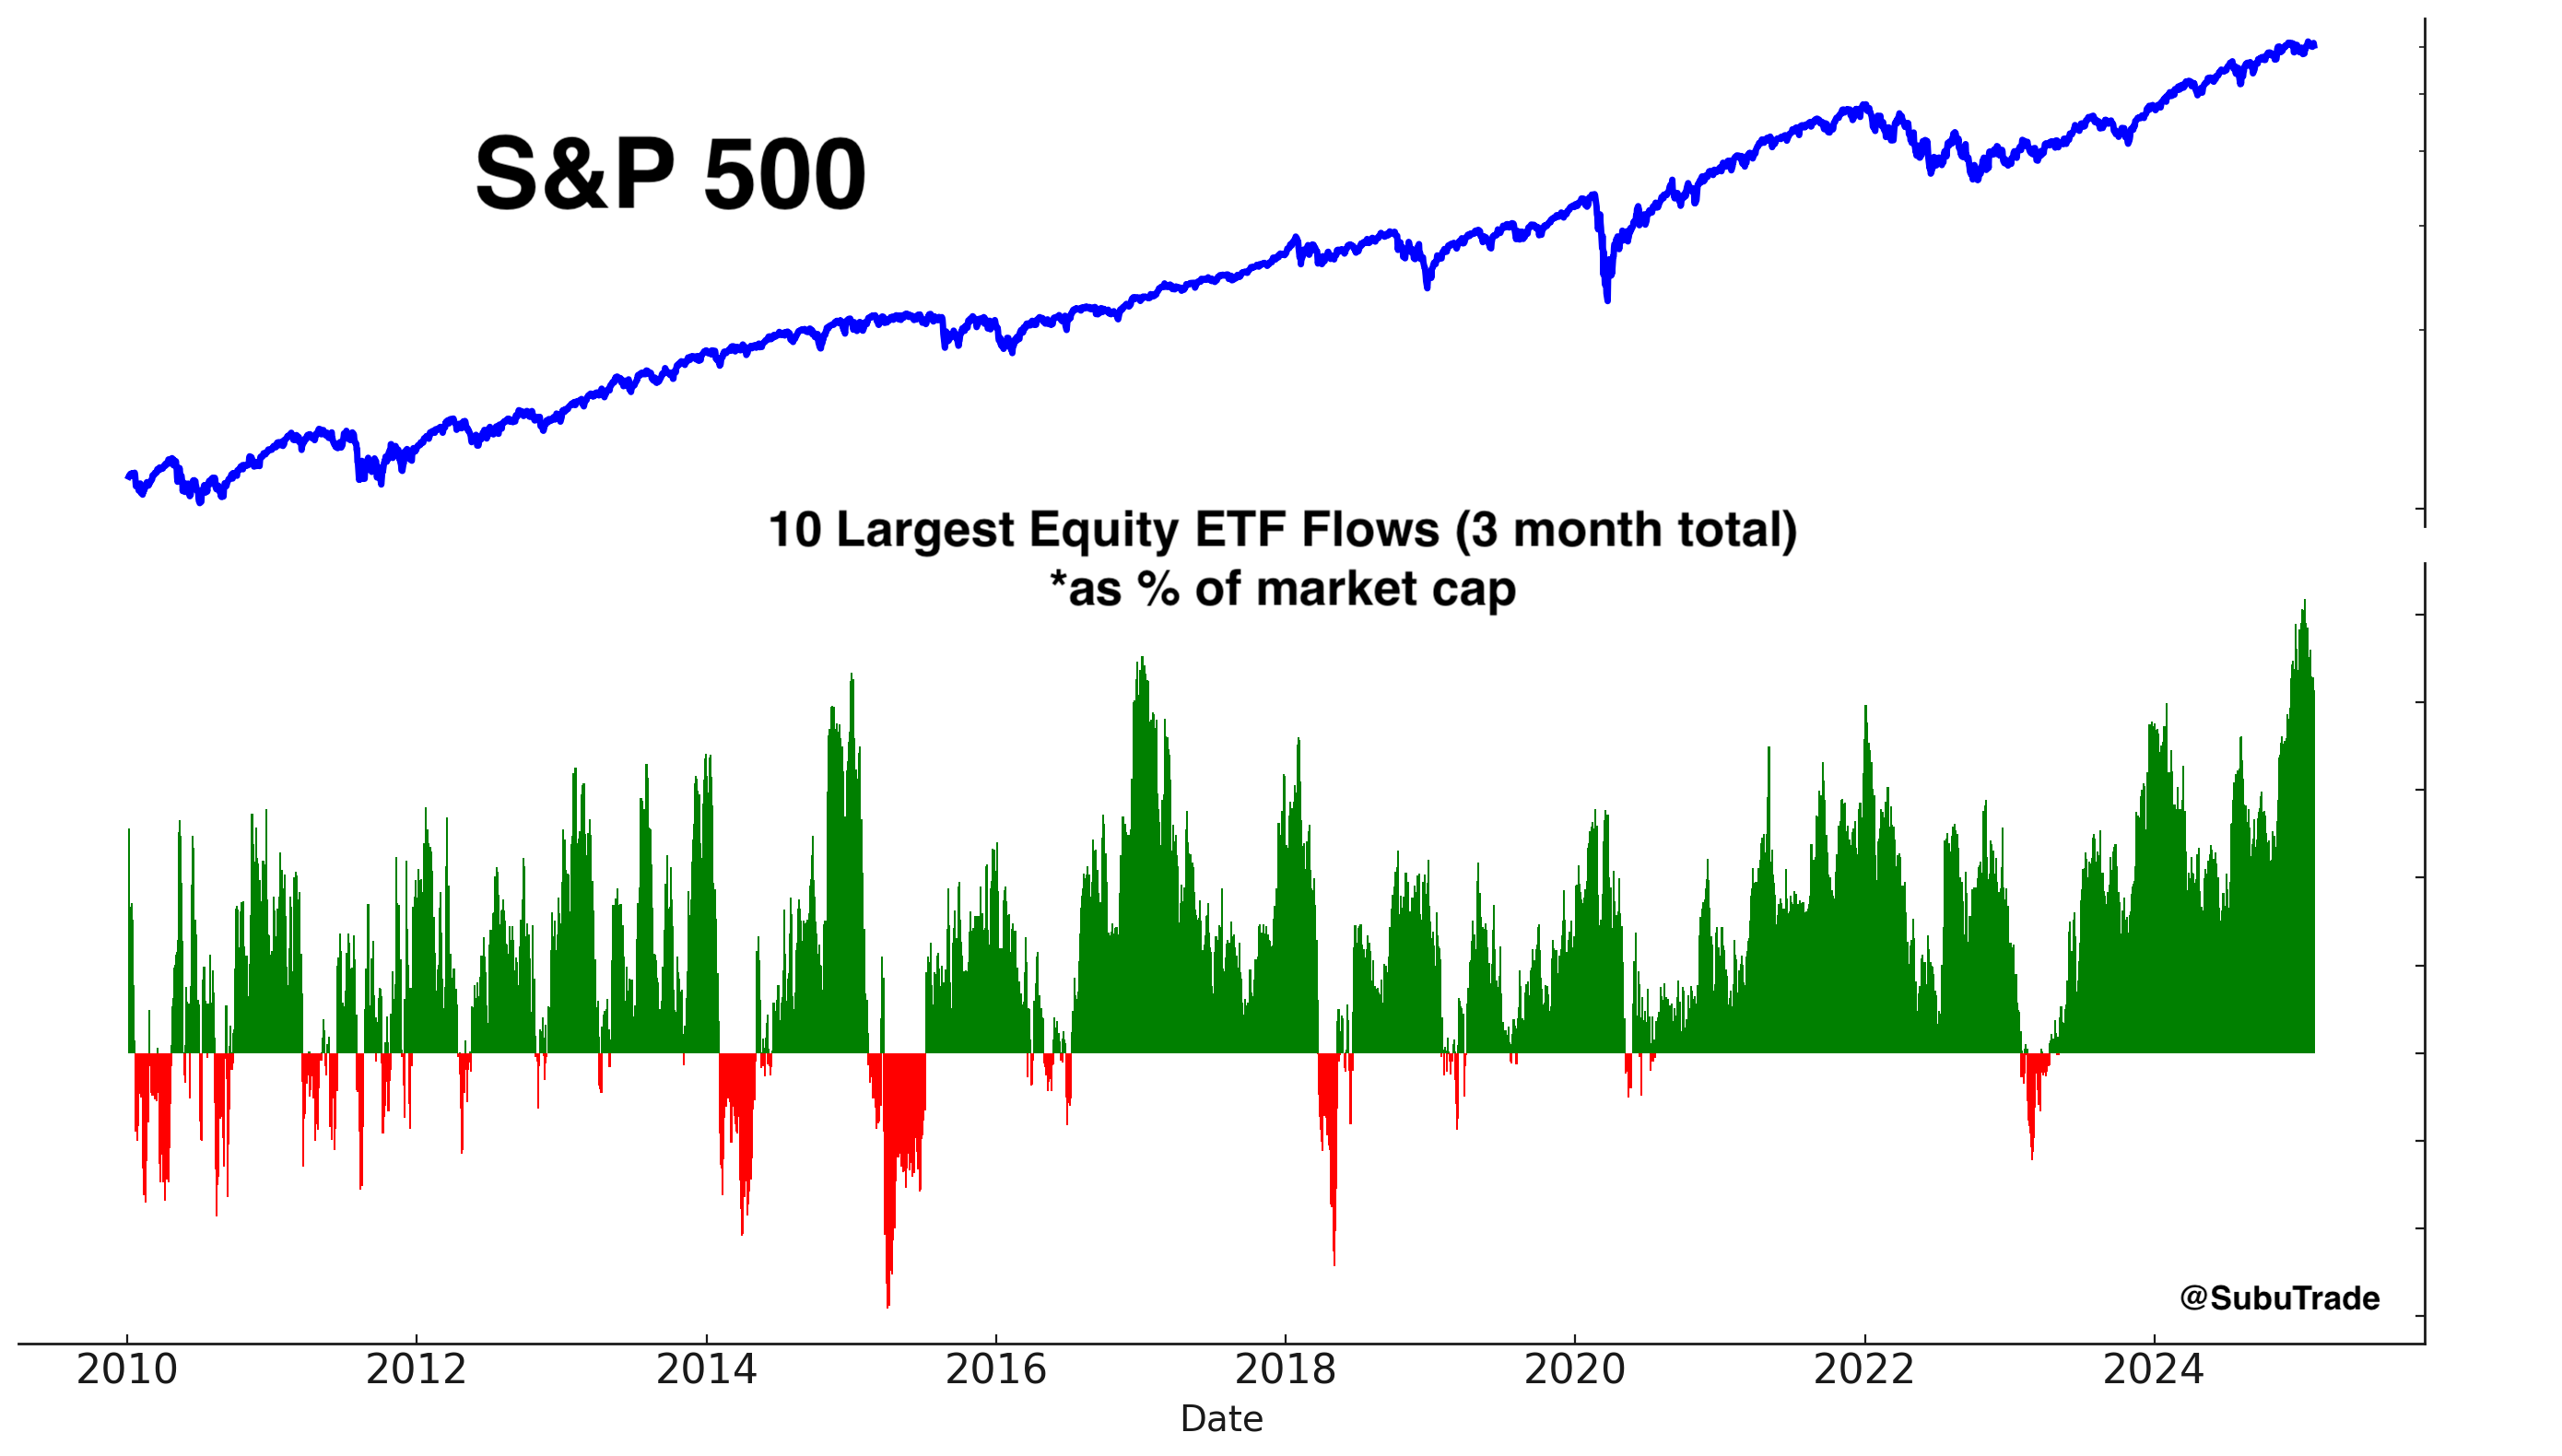
Fund Flows
Here’s the latest update on equity ETF fund flows, a key concern I’ve been monitoring in recent weeks. While inflows remain elevated, they are beginning to decline. The U.S. stock market’s prolonged sideways price action appears to be unnerving investors.
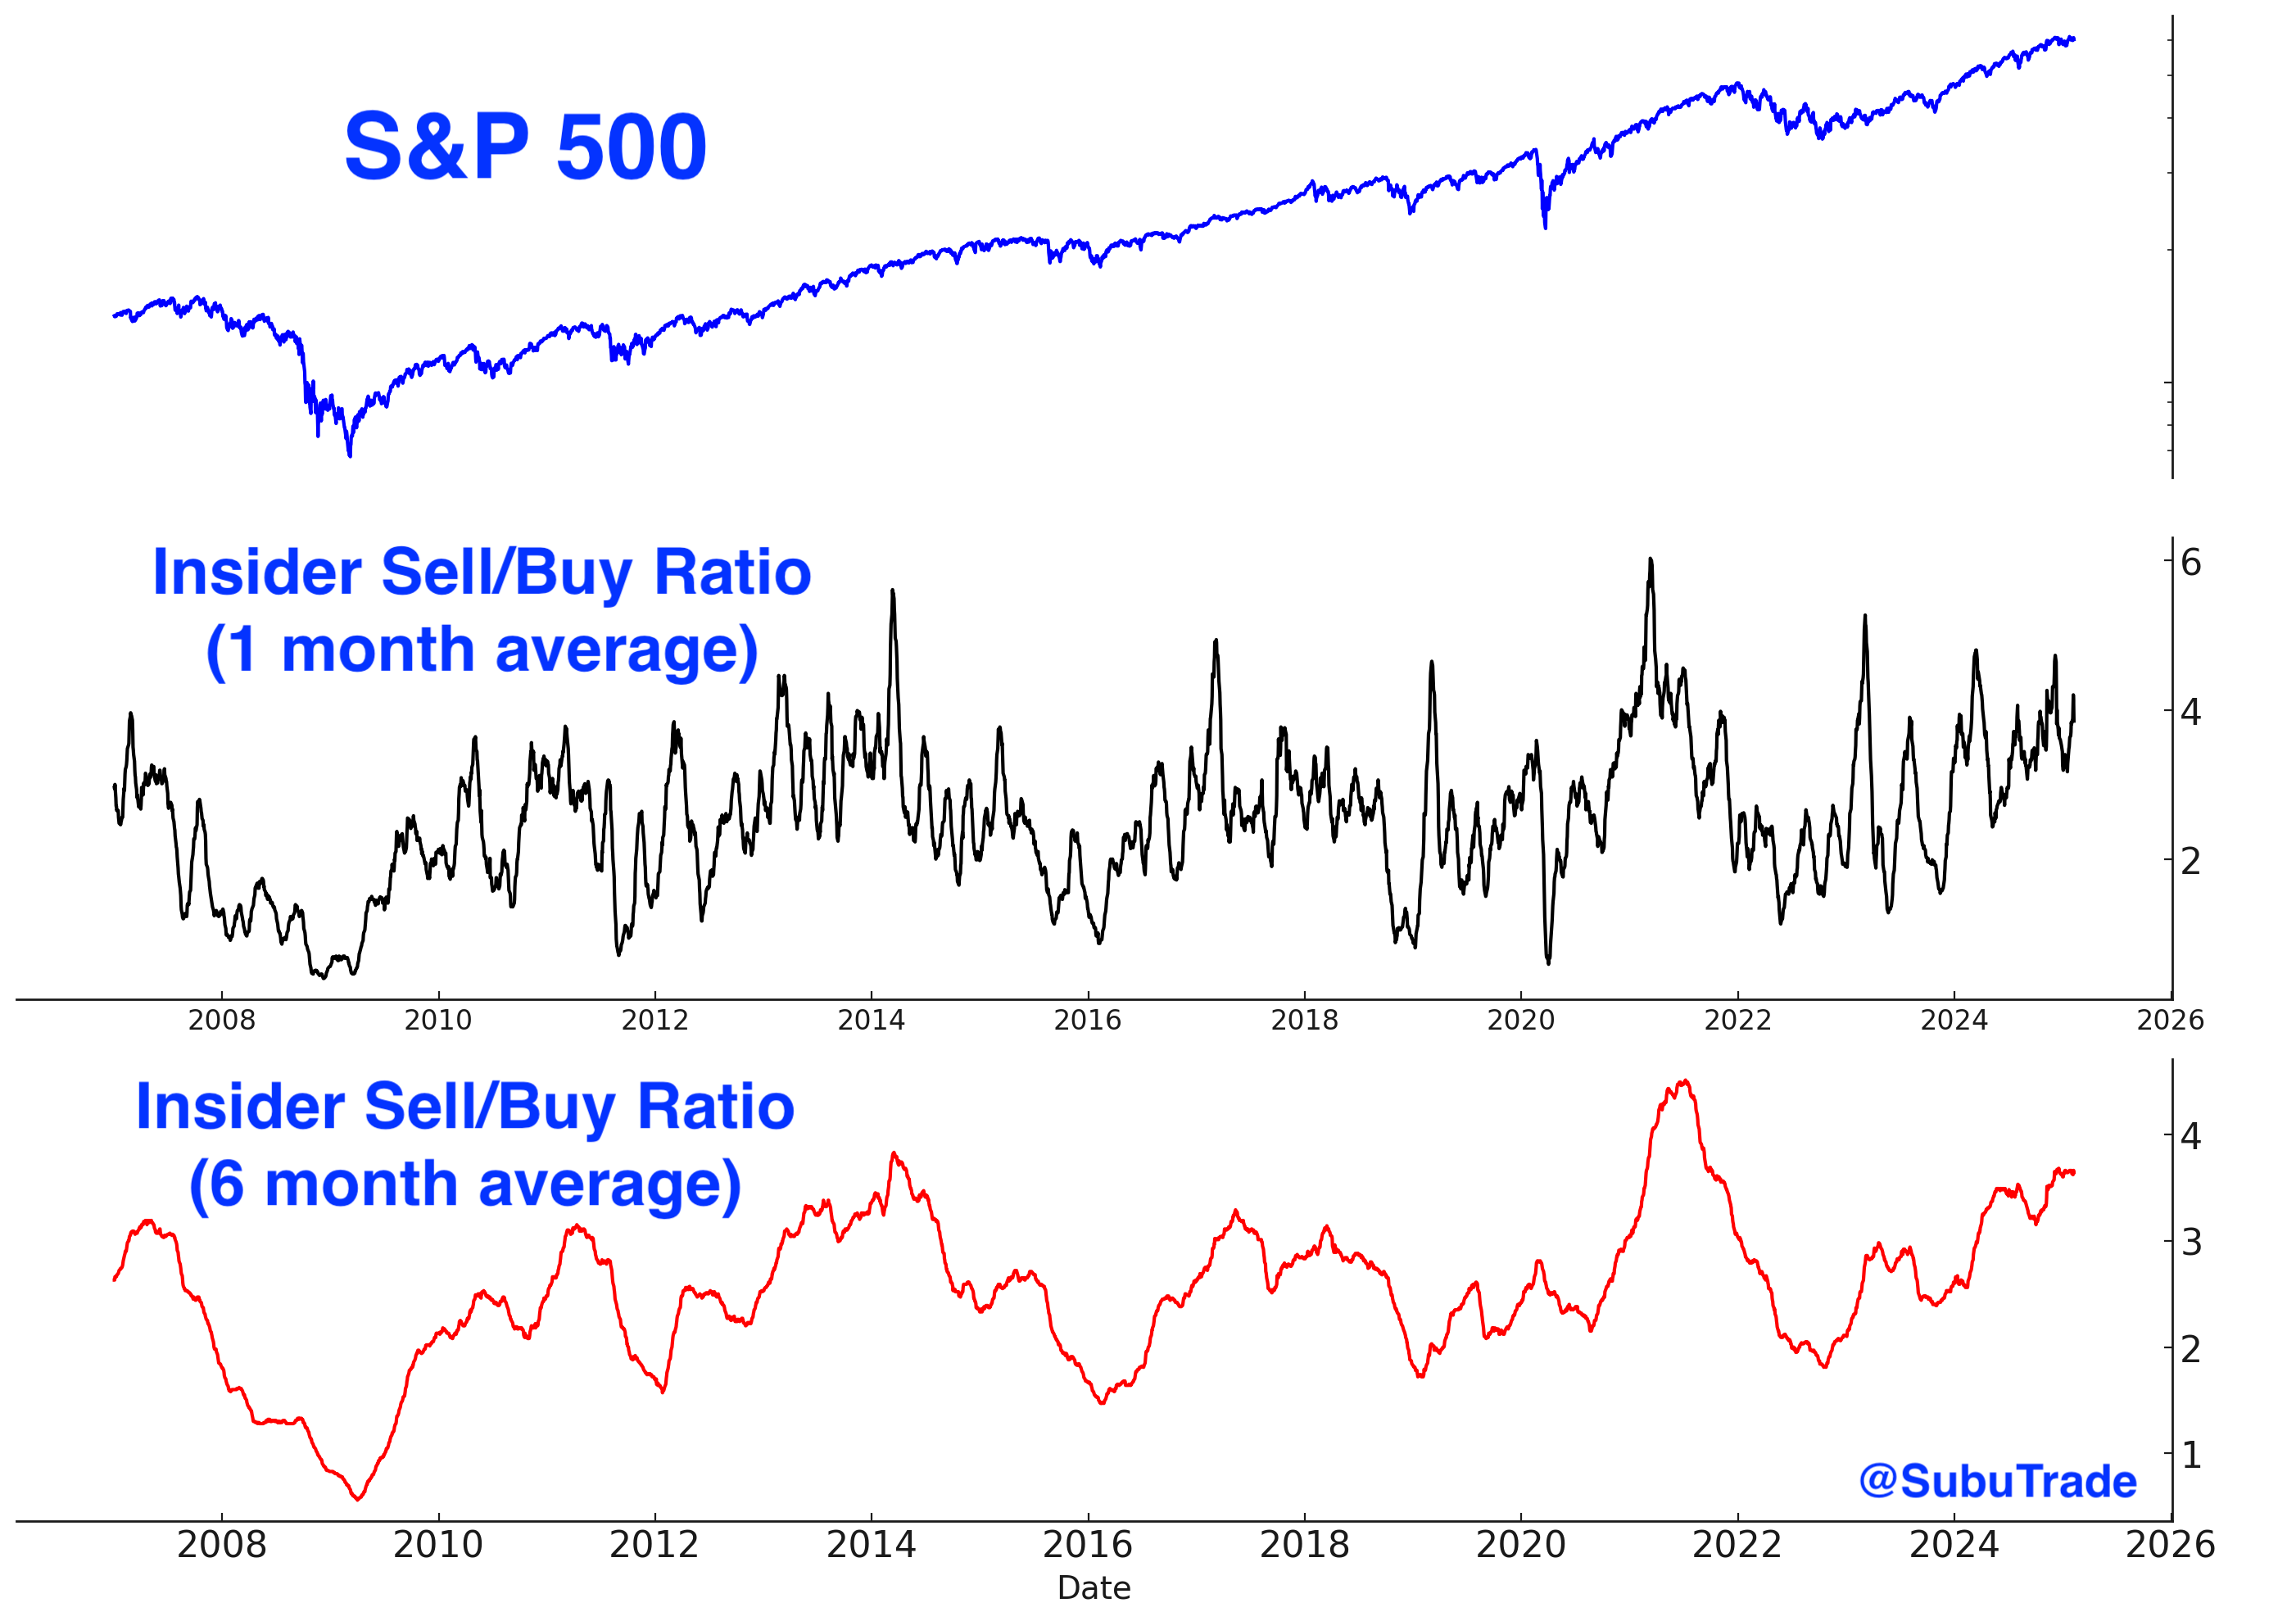
Corporate Insiders
With the stock market trading near all-time highs, corporate insiders are seizing the opportunity to unload shares once again:
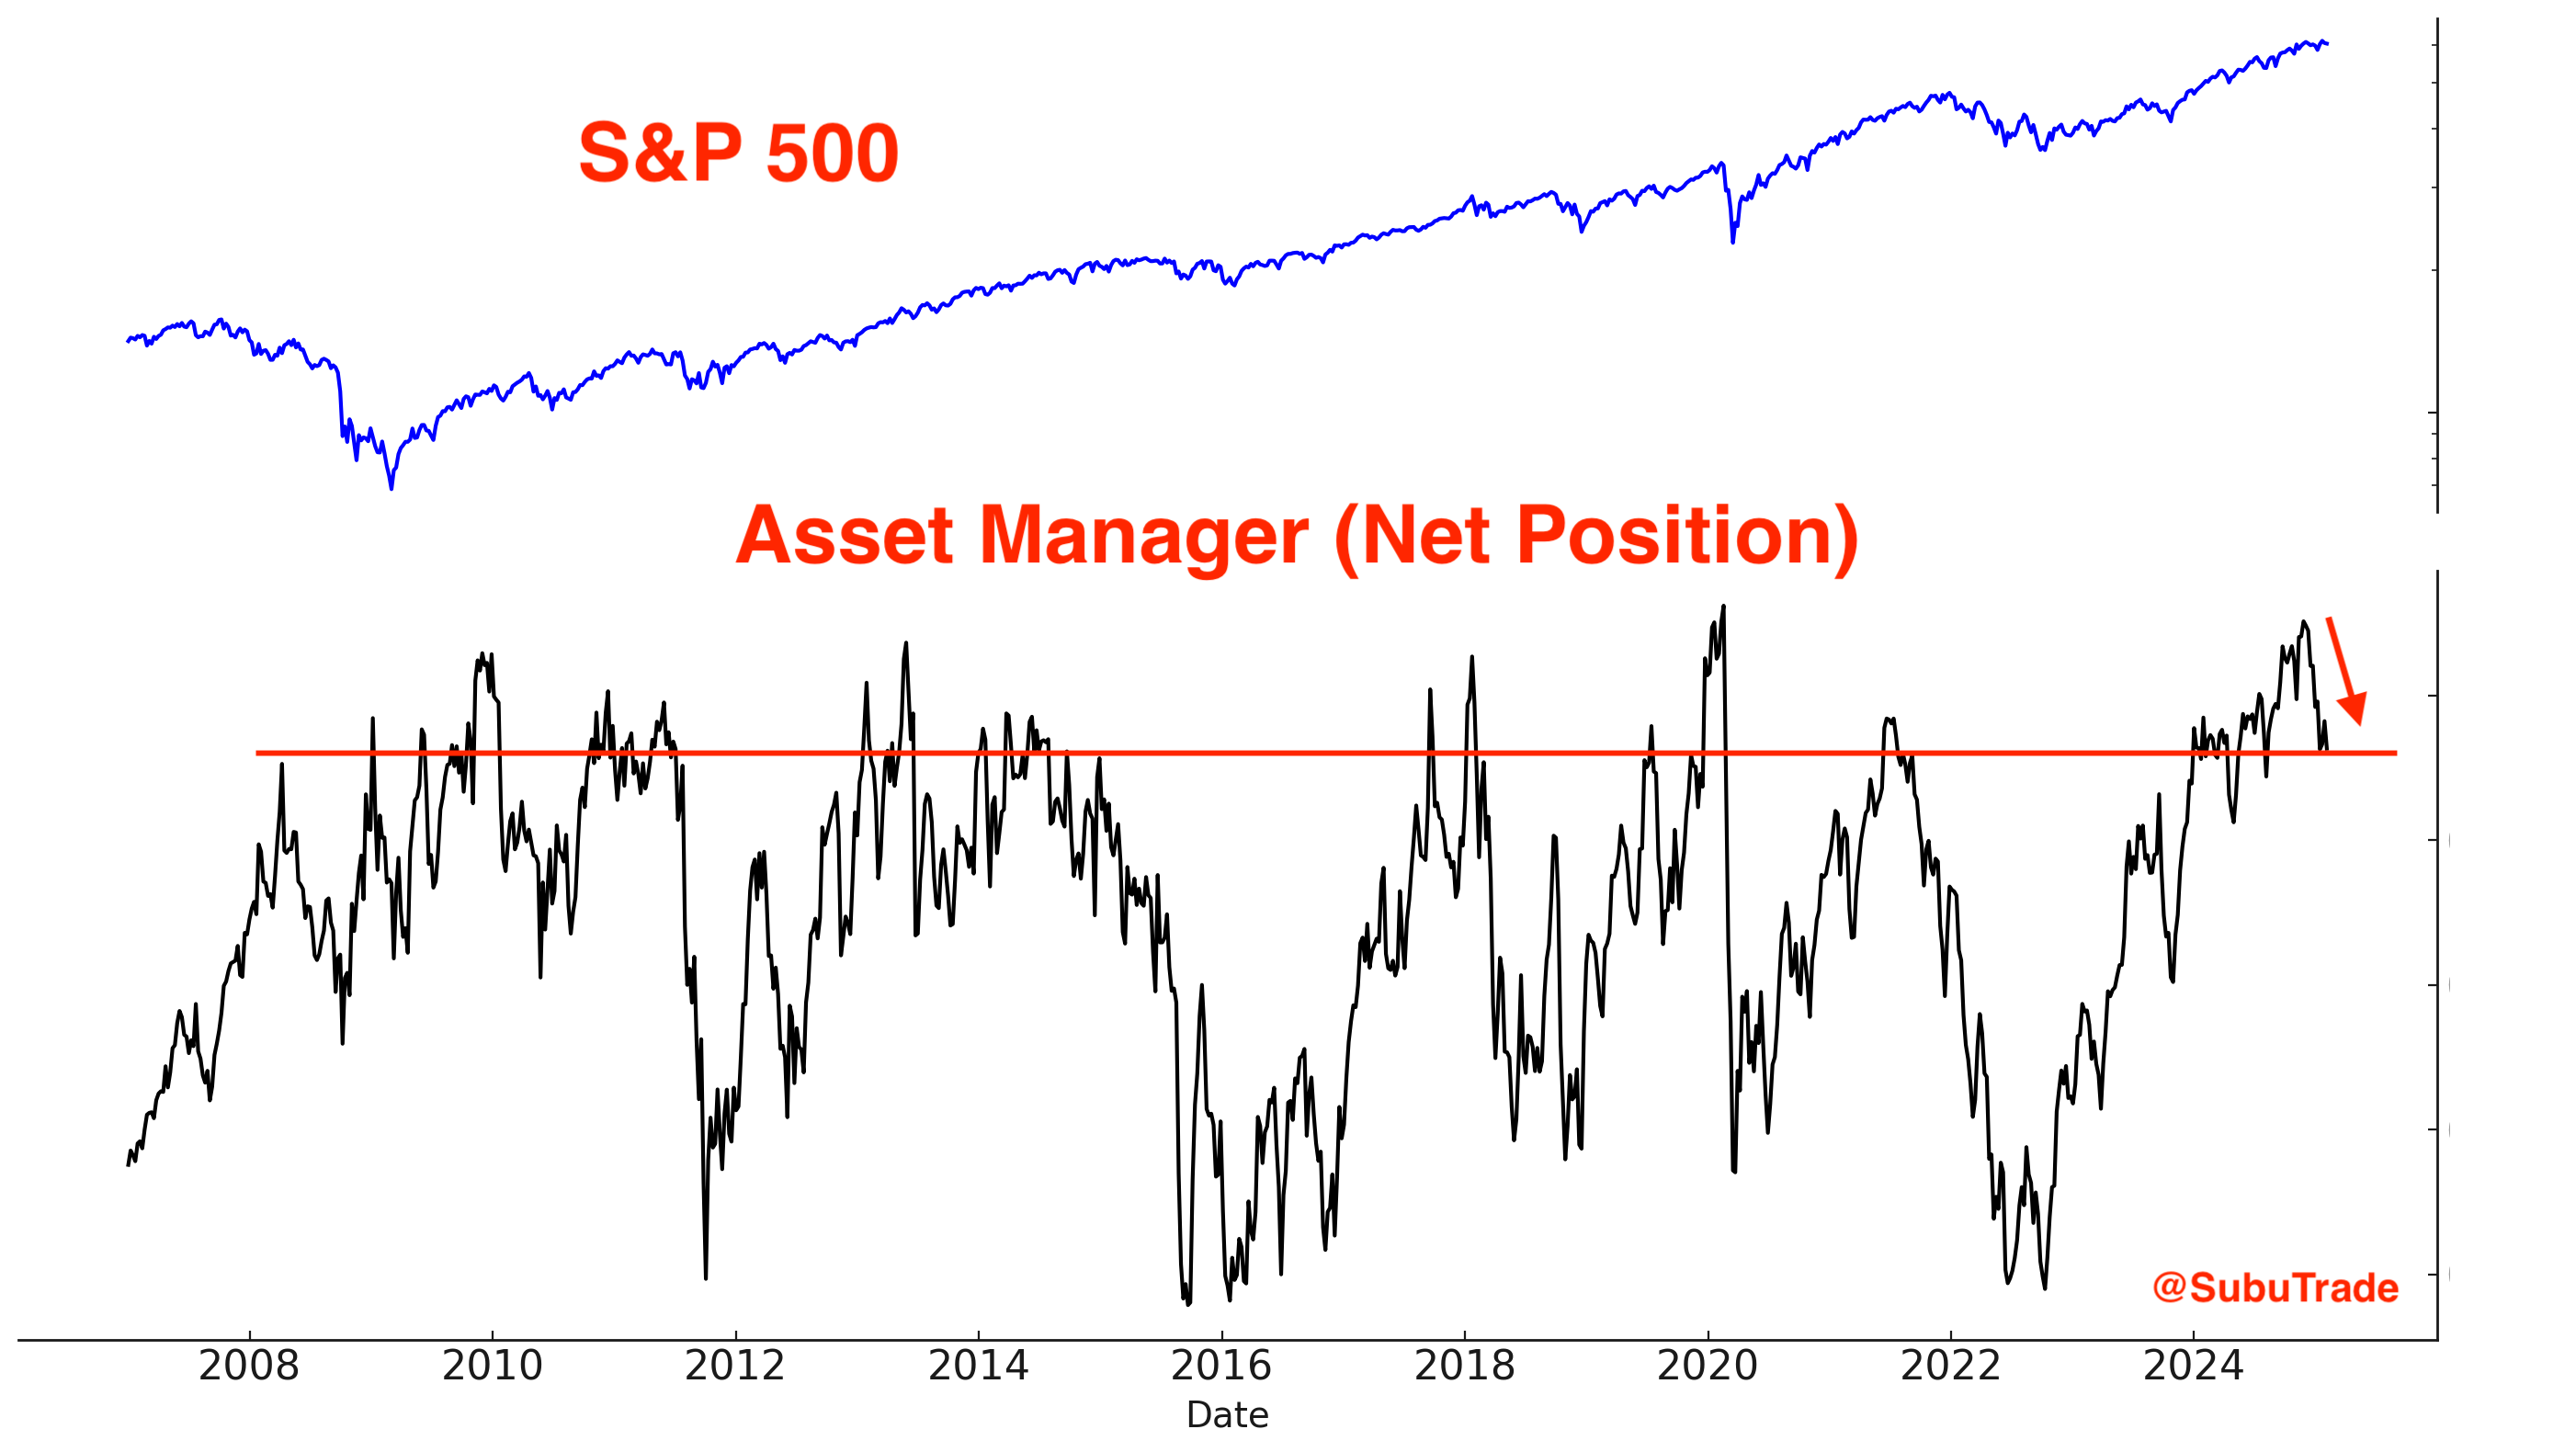
COT (Commitments of Traders)
Asset Managers remain long equities, although they have pared back their exposure in recent weeks. Institutional investors have been selling the rallies while retail investors have been buying the dips. Retail’s “buy the dip” mentality works — until it doesn’t.
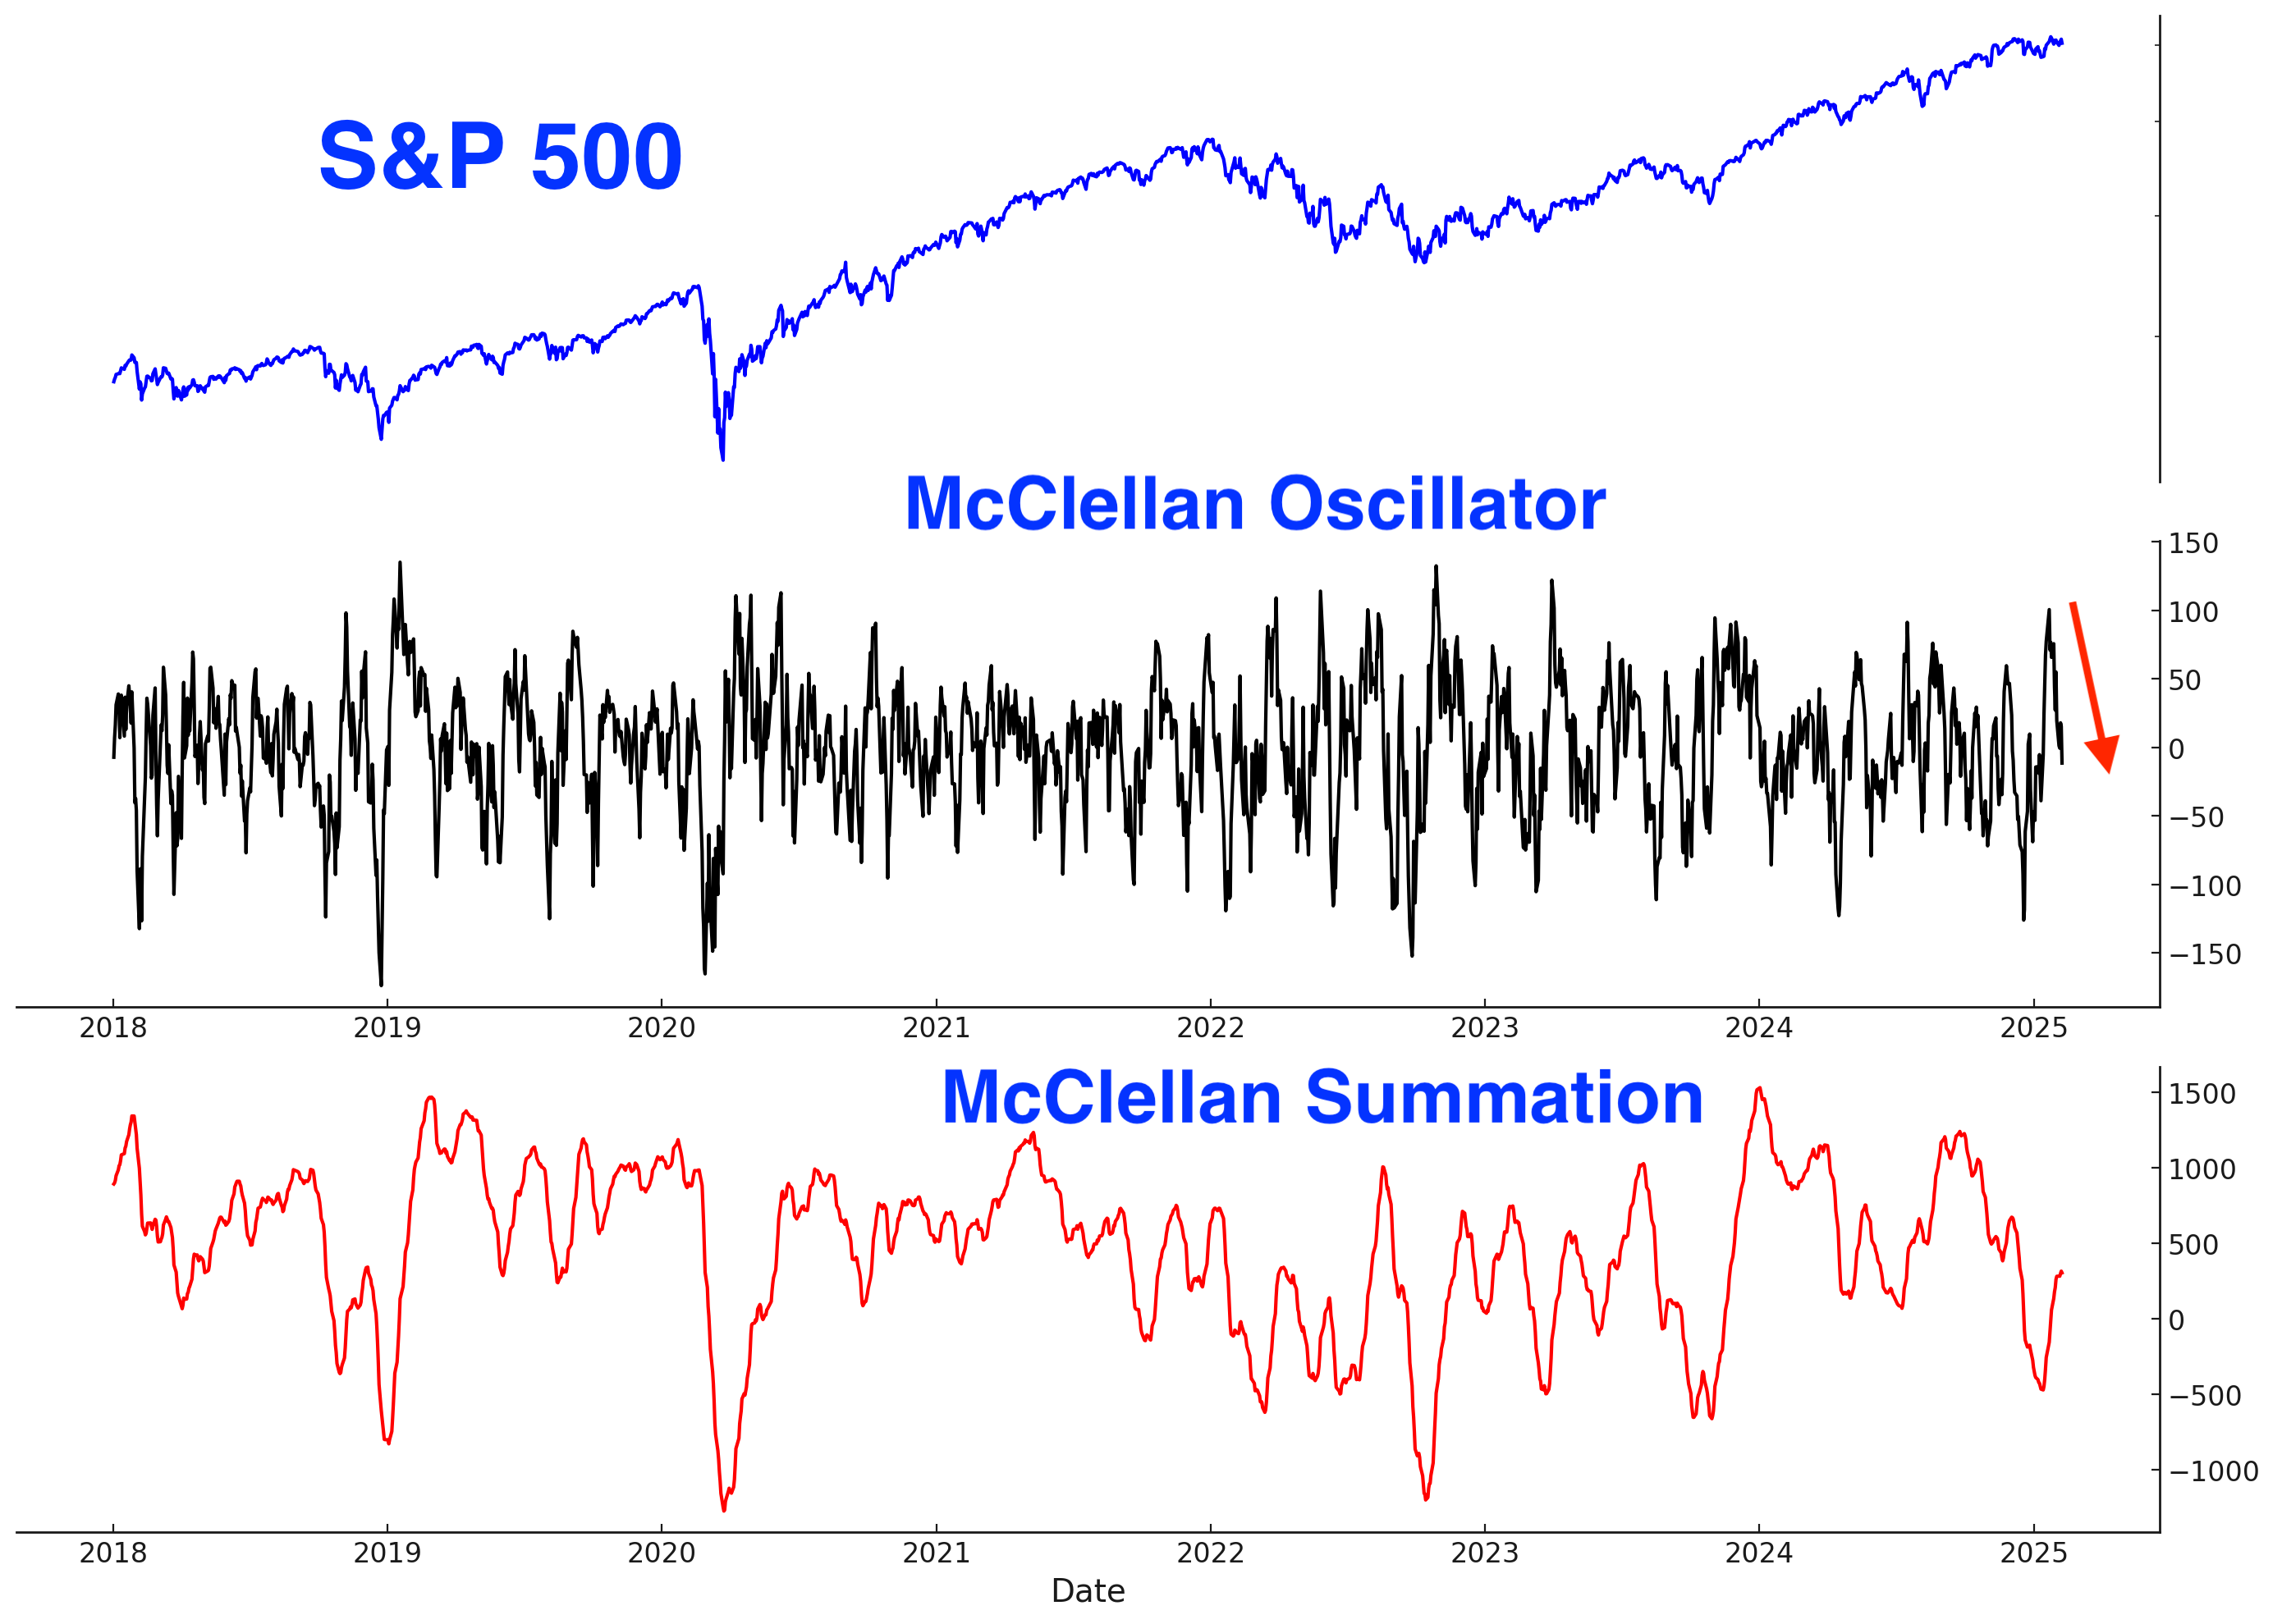
Breadth
Here’s the % of S&P 500 stocks above their 200 and 50 day moving averages:
Here’s the S&P 500 McClellan Oscillator and McClellan Summation Index:
Trend:
Despite all the long term concerns, the U.S. stock market remains in an Up Trend, for now.
The trend is your friend, until it ends. Will it end now? The S&P 500 has remained above its 200 day moving average for more than a year while the NASDAQ 100 has remained above its 200 day moving average for almost 2 years!
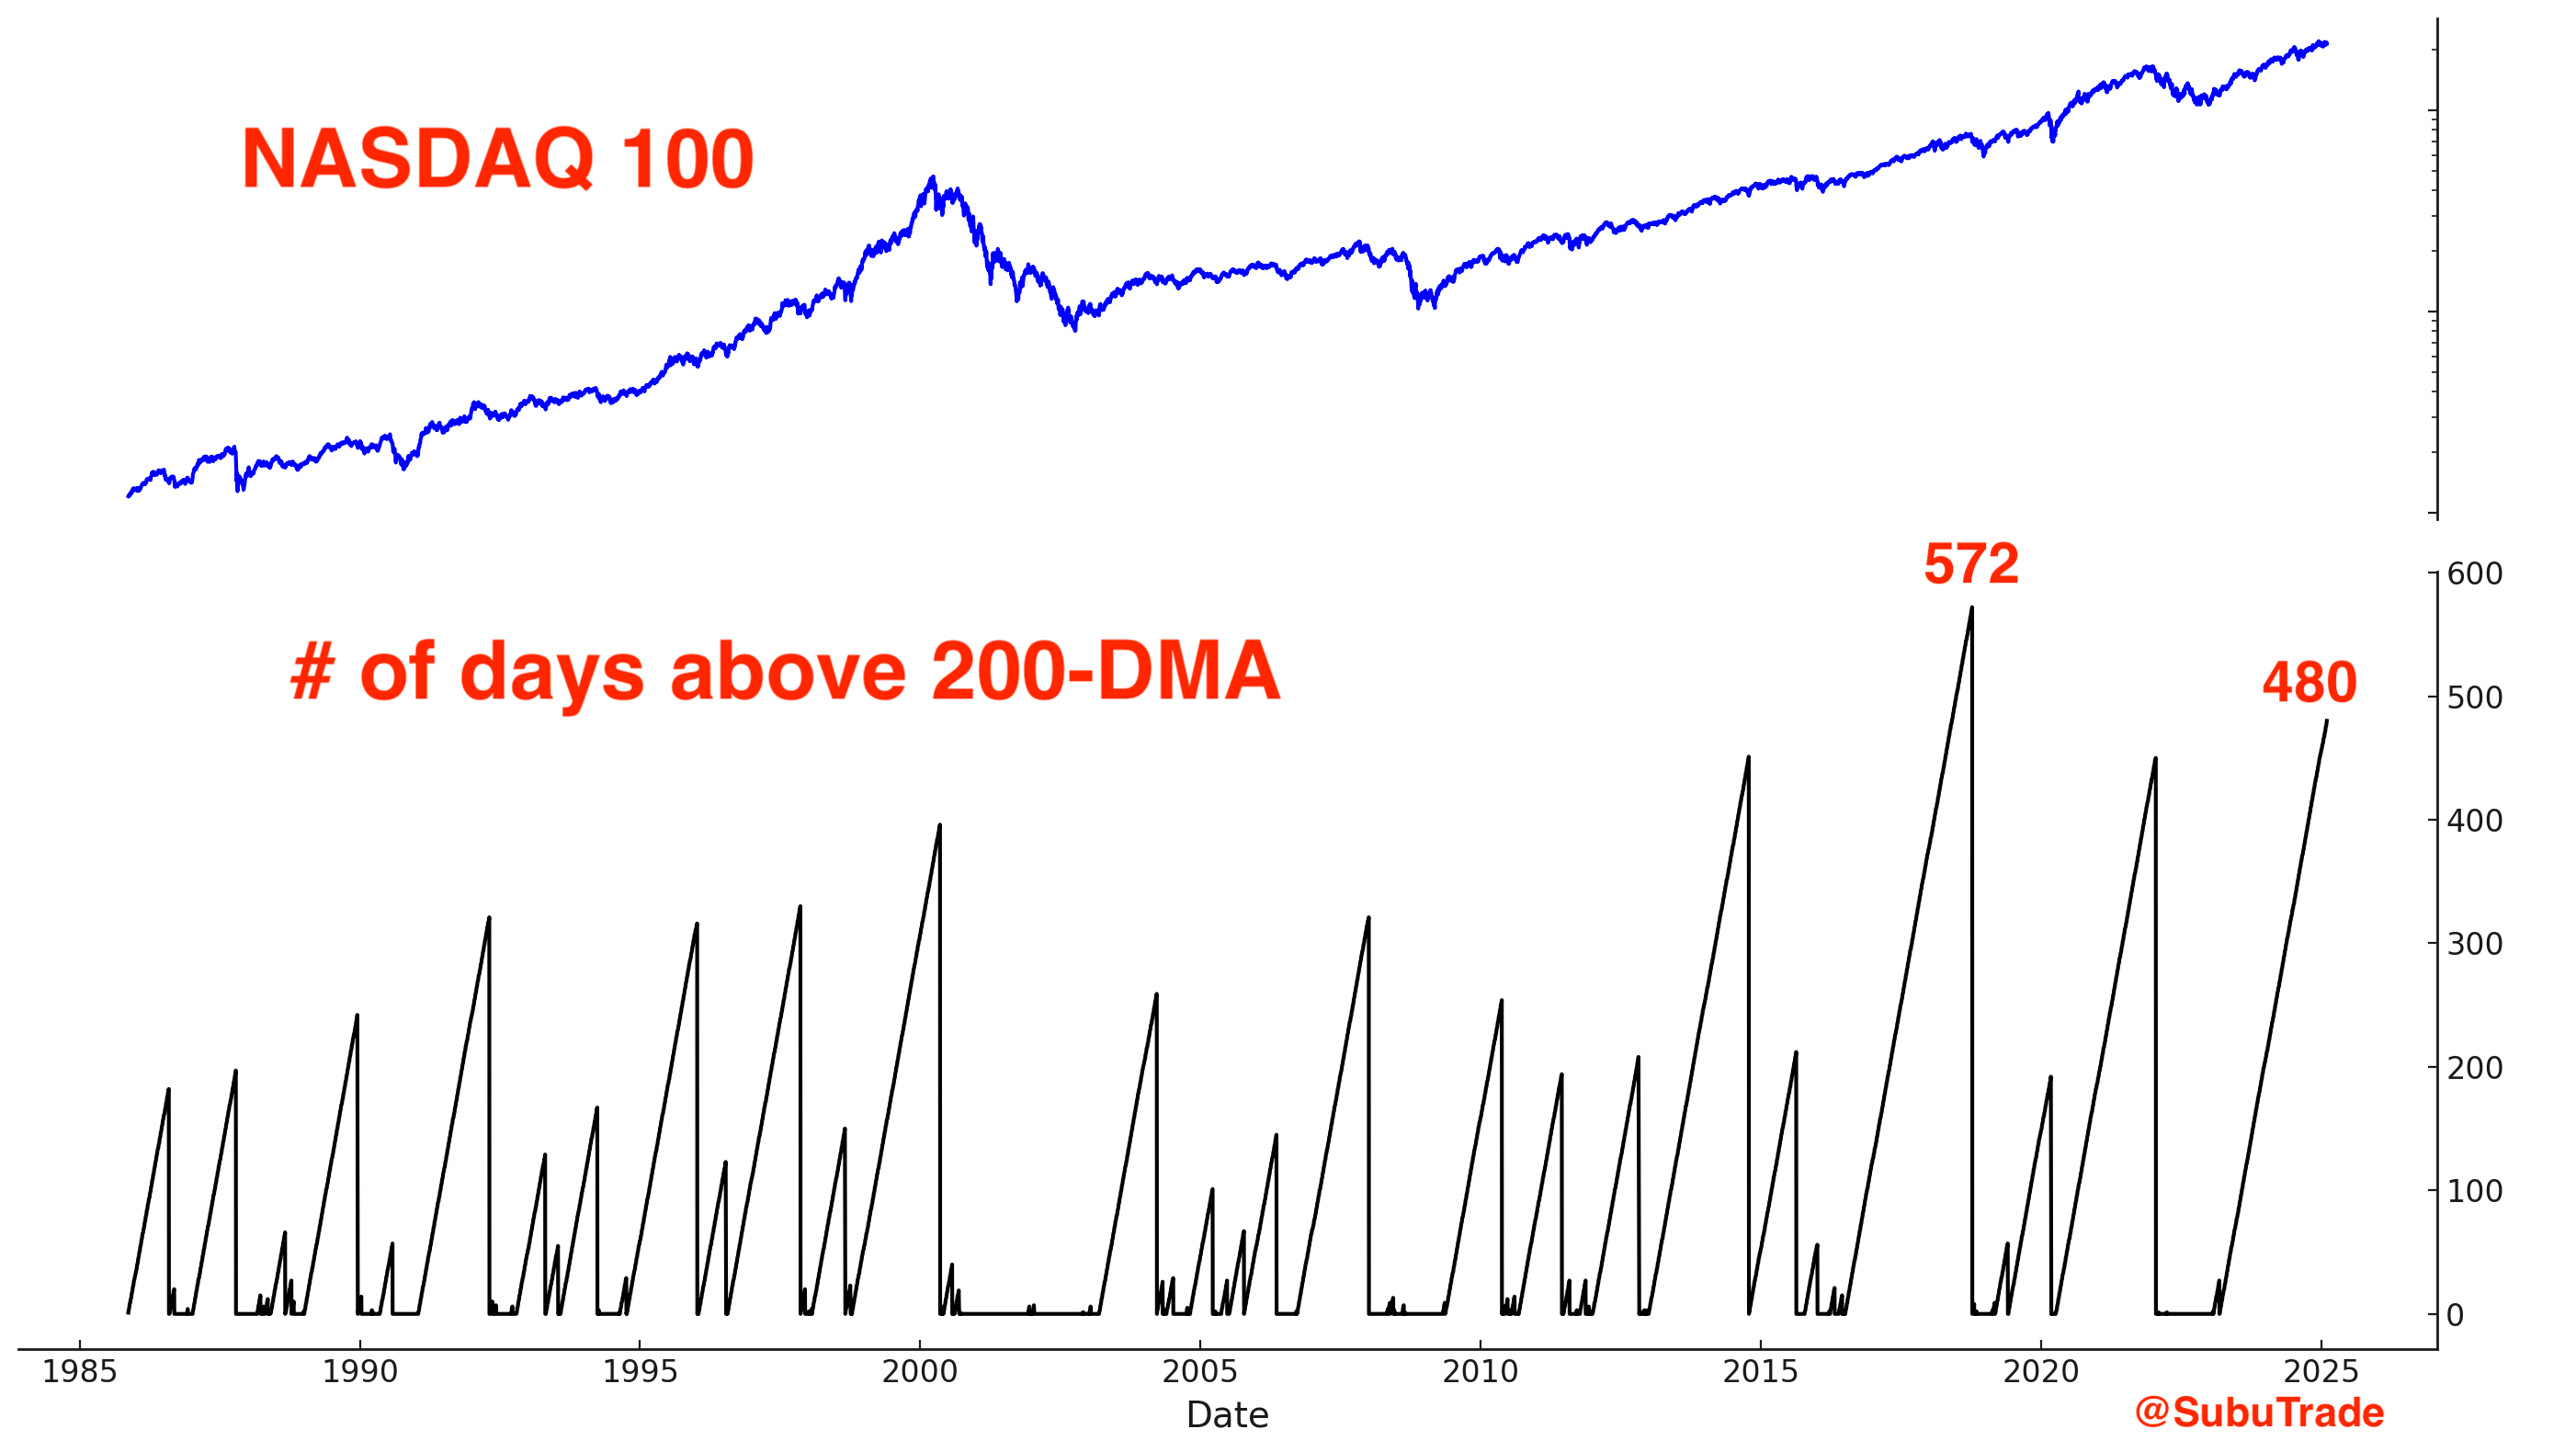
Eventually this streak will end — it’s only a matter of “when”.
Overall, neither equity bulls nor bears hold a clear advantage in the current market environment. The U.S. stock market continues to follow a pattern reminiscent of 2015:
As U.S. equities remain range-bound, significant movements are unfolding in other markets.
China, India, gold, and silver
China
"China" is poised to be a dominant market theme in 2025. Markets influenced by the U.S.-China economic war are witnessing large moves and big setups right now.
I outlined the bullish case for China in previous Markets Reports. Chinese stocks are currently trending higher.
Gold, silver, and miners
A long position in gold aligns with the broader China theme, as the yellow metal stands to gain from escalating U.S.-China economic tensions.
Consider this: If you were the Chinese government, would you feel secure holding hundreds of billions in U.S. Treasury bonds—assets that the U.S. could freeze or confiscate at any moment? Or would you prefer to shift reserves into an asset beyond U.S. control, such as gold? This strategic move toward non-seizable reserves is the main driver behind gold’s bull market. This is evidenced in the following charts.
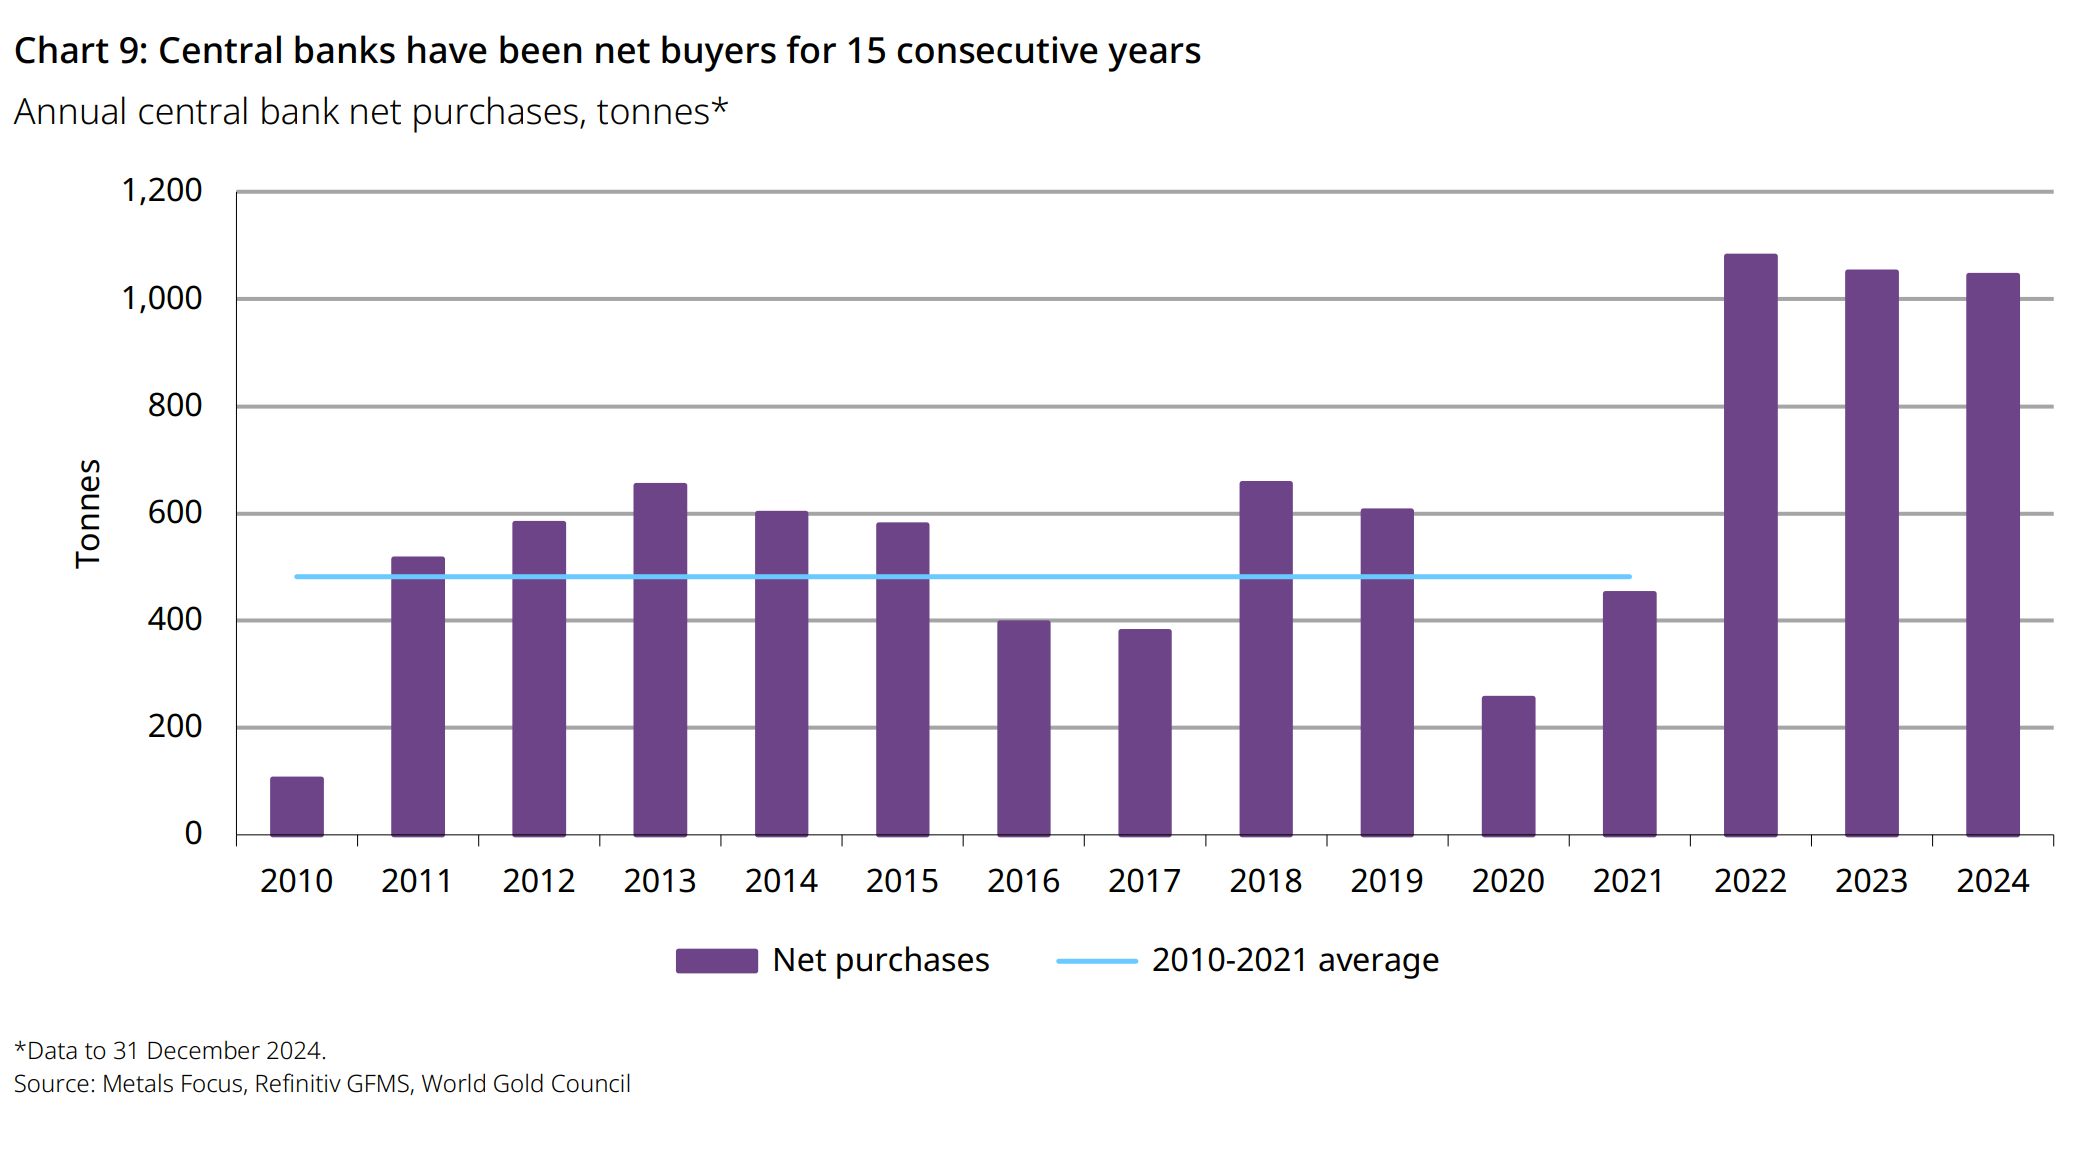
For the third year in a row, we’ve seen central banks purchase more than 1,000 tonnes of gold. And these are simply the known purchases (real purchases by e.g. China are likely much higher):
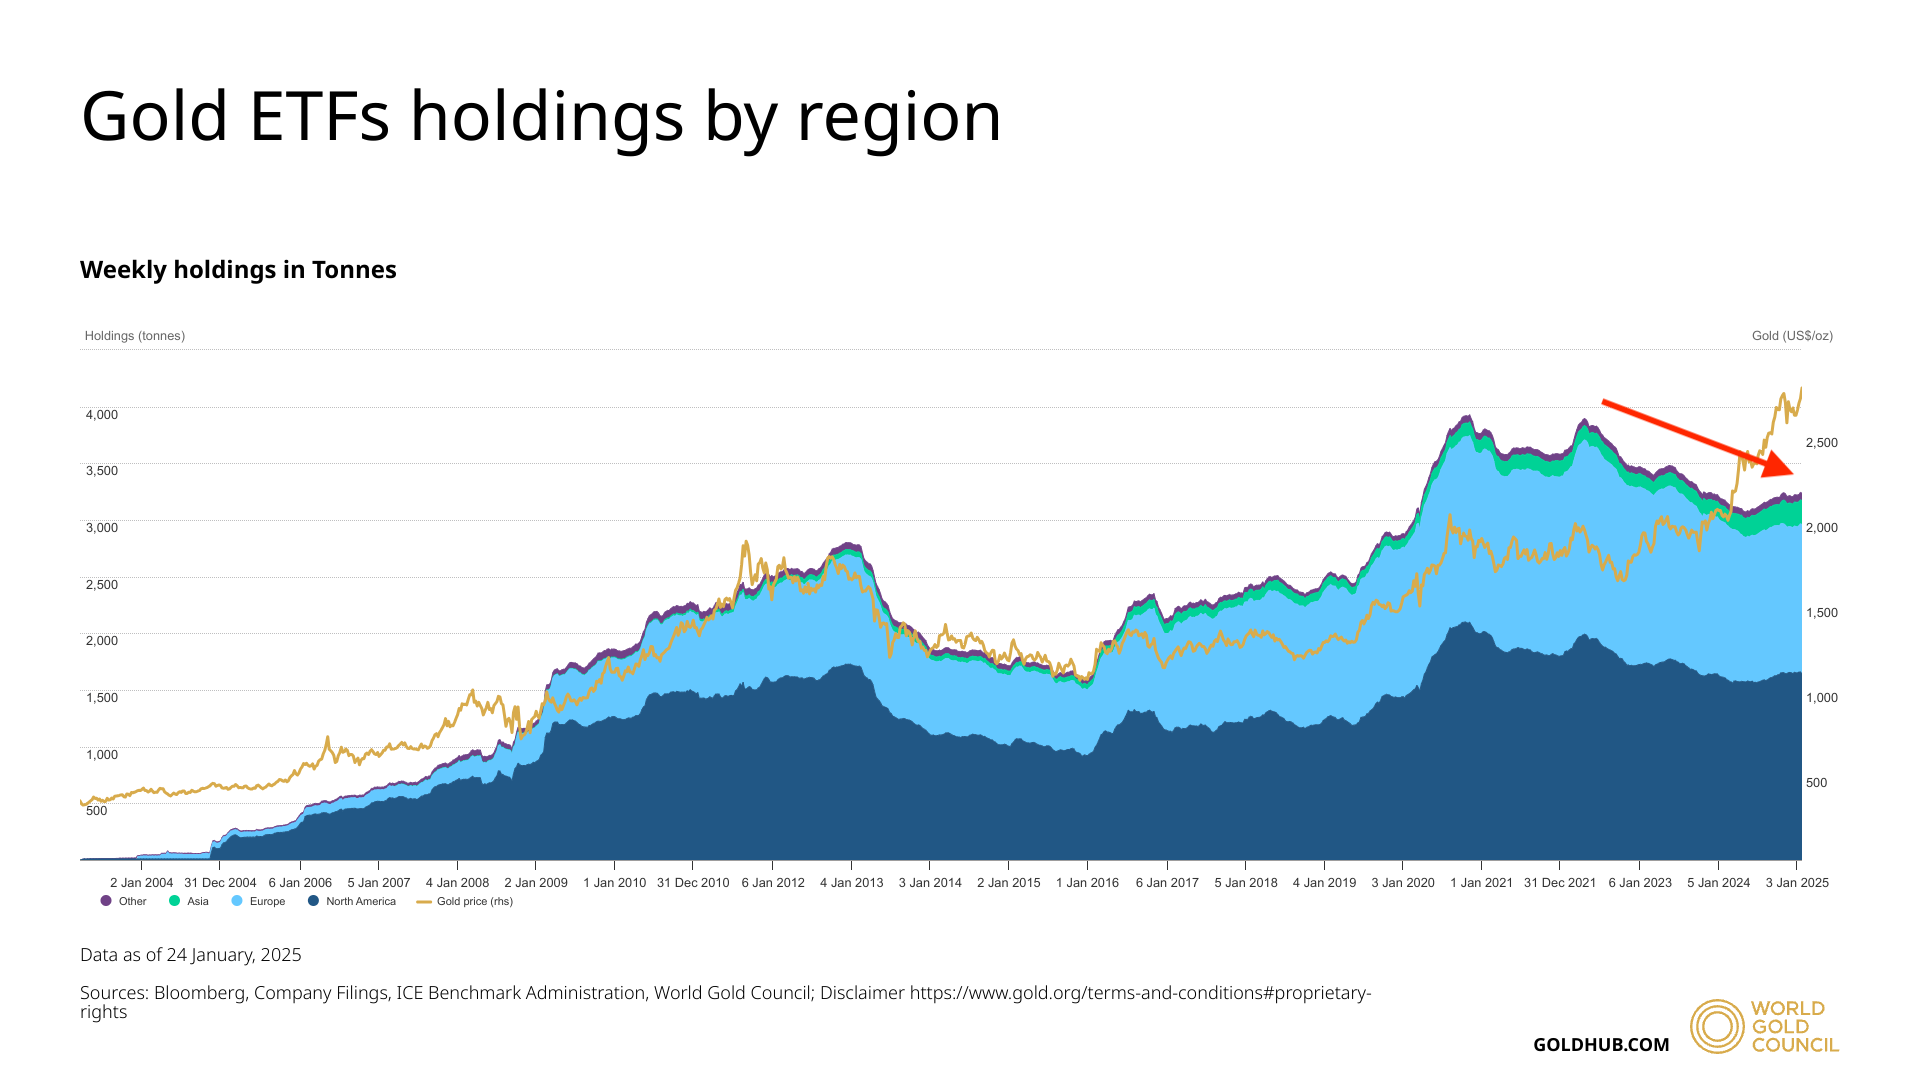
While central banks continue to accumulate gold, retail investors remain largely on the sidelines. The following chart highlights gold holdings in ETFs. Historically, gold bull markets have been accompanied by rising prices and increasing ETF holdings. However, in the current bull market, gold prices are climbing while ETF investors are exiting—a notable divergence.
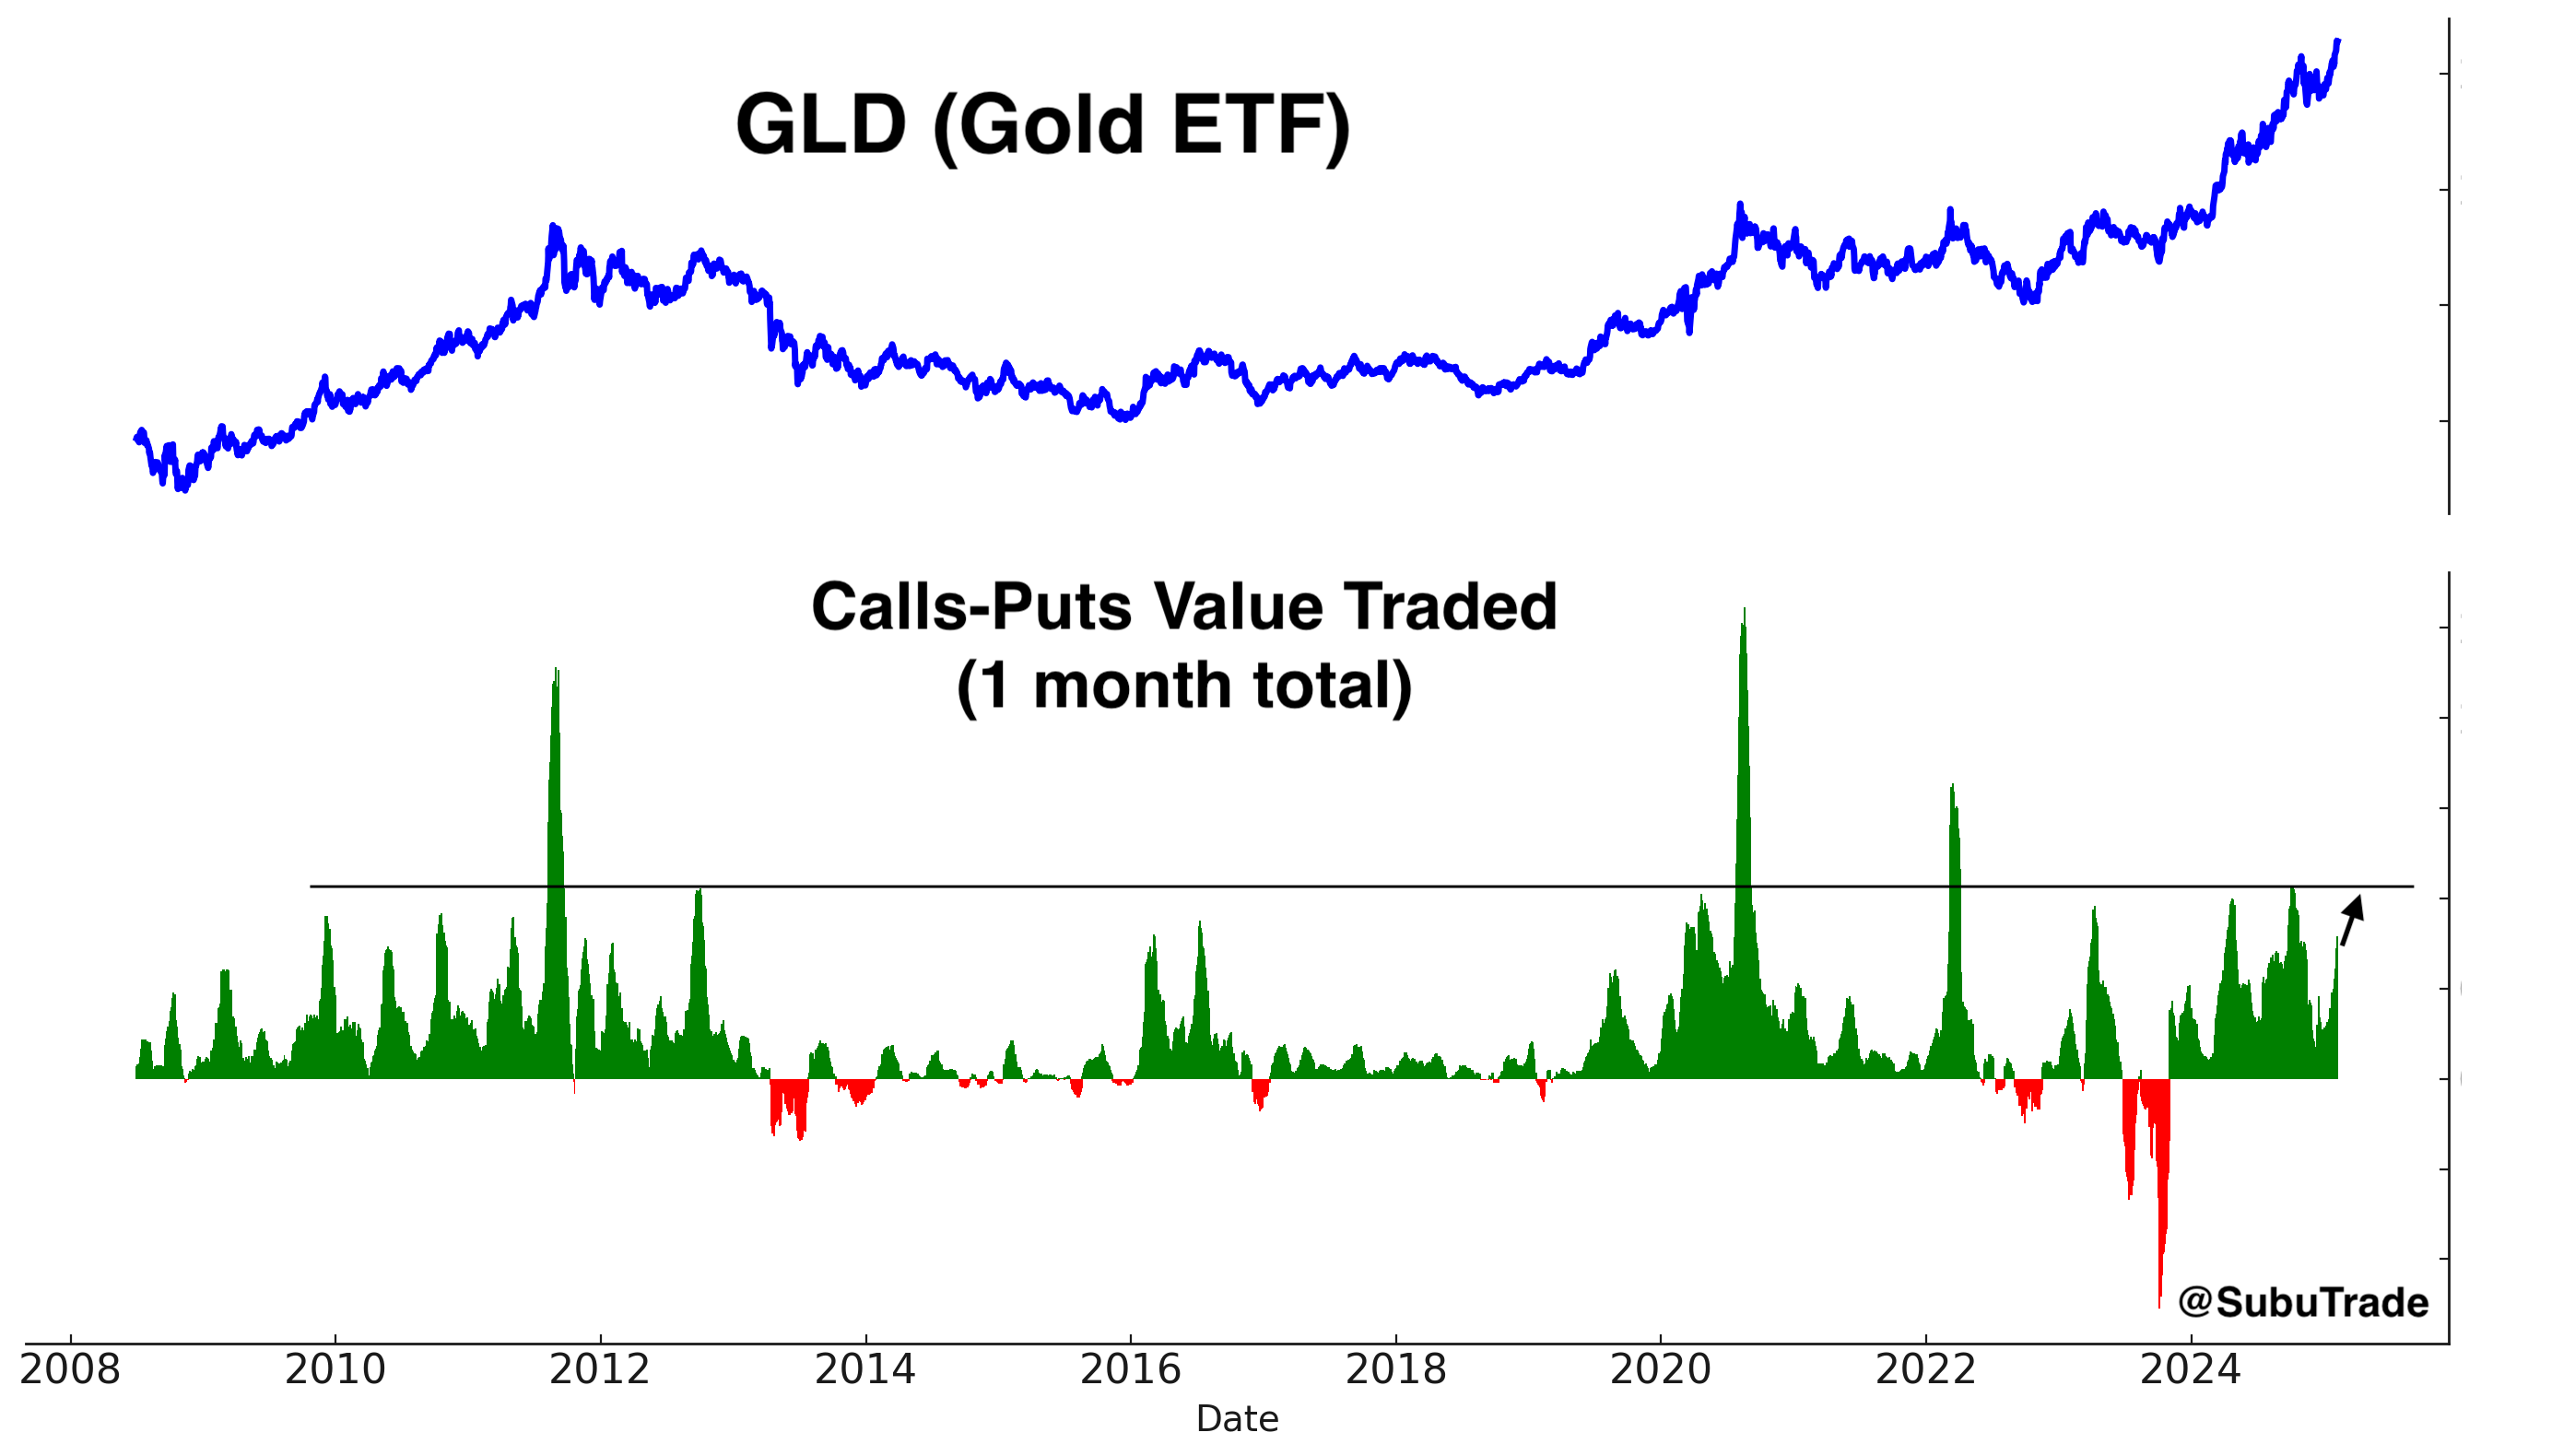
I’m bullish on gold, which has room to rally farther before running into resistance.
Here’s the value of Calls-Puts traded for GLD over the past month. This figure is approaching concerning levels, but not quite there yet.
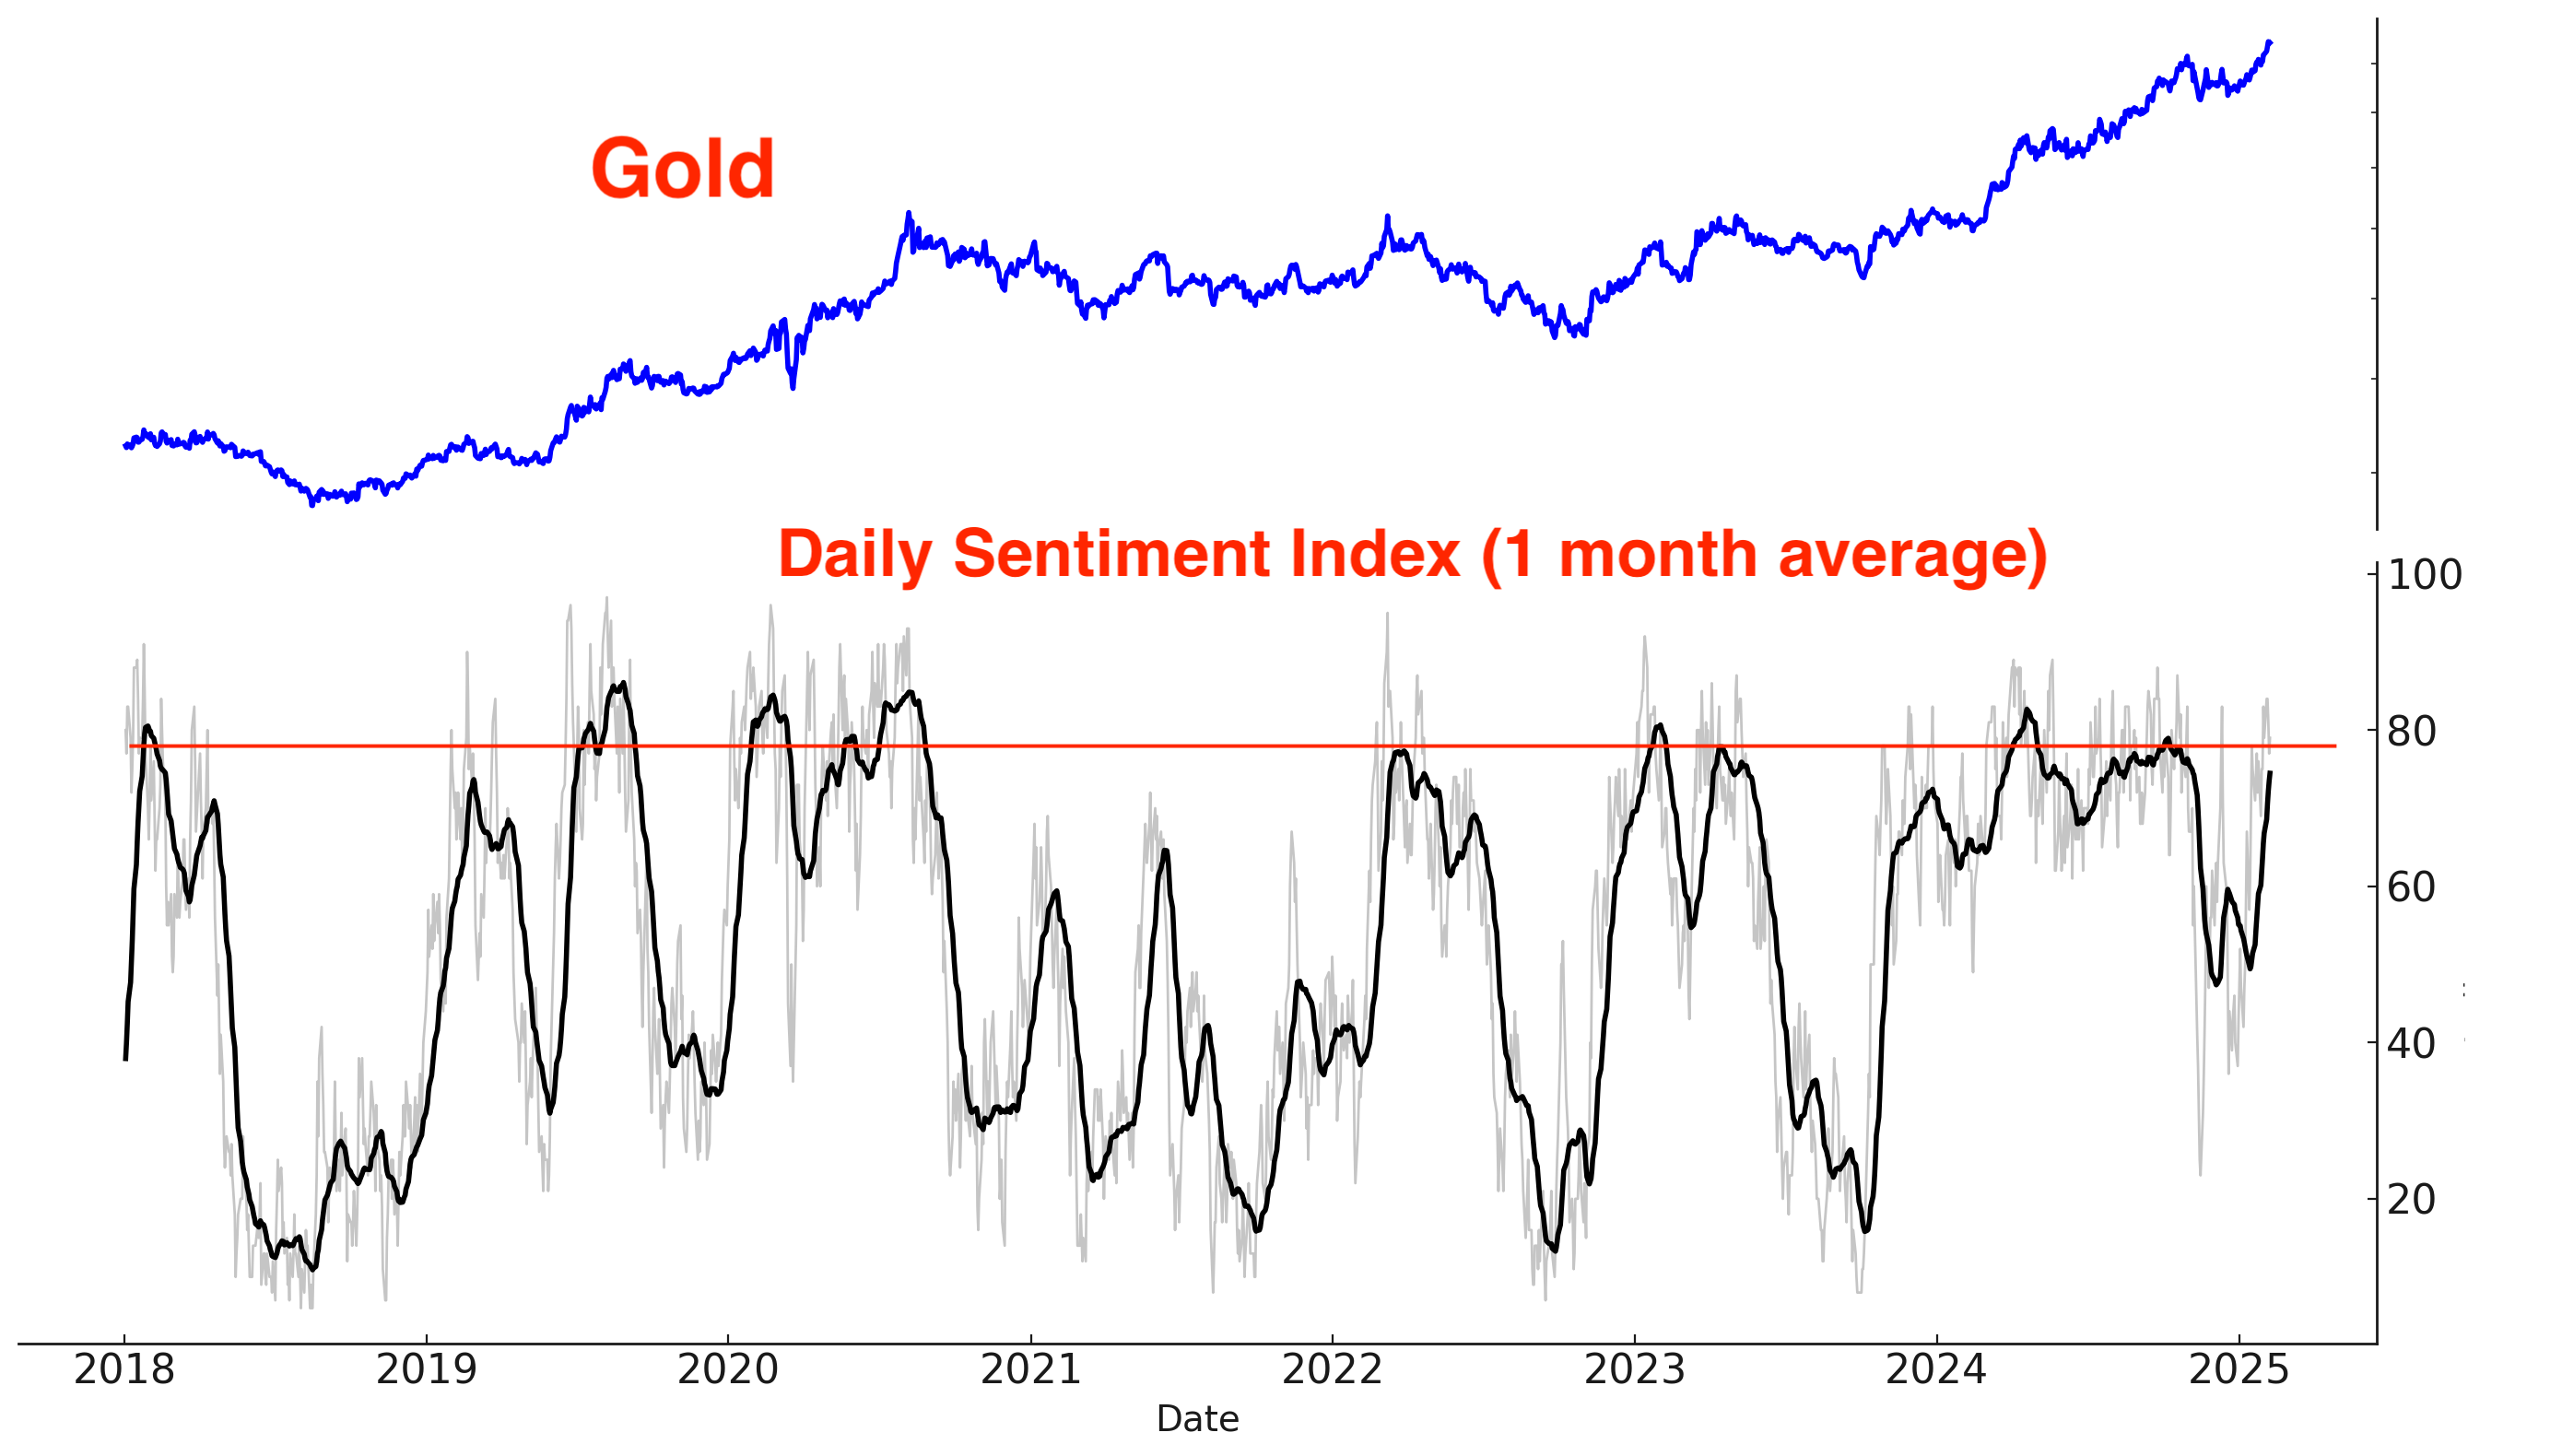
Similarly, gold’s Daily Sentiment Index is rising rapidly and nearing concerning levels. Monitor this closely in the coming days/weeks:
Gold remains in a strong Up Trend:

Gold Miners rallied significantly in the past few weeks. Here’s the GDX Options Flow Index. A minor short term concern:
While gold and gold miners continue to climb, silver remains relatively weaker. However, silver has the potential to catch up as the broader precious metals rally gains momentum.
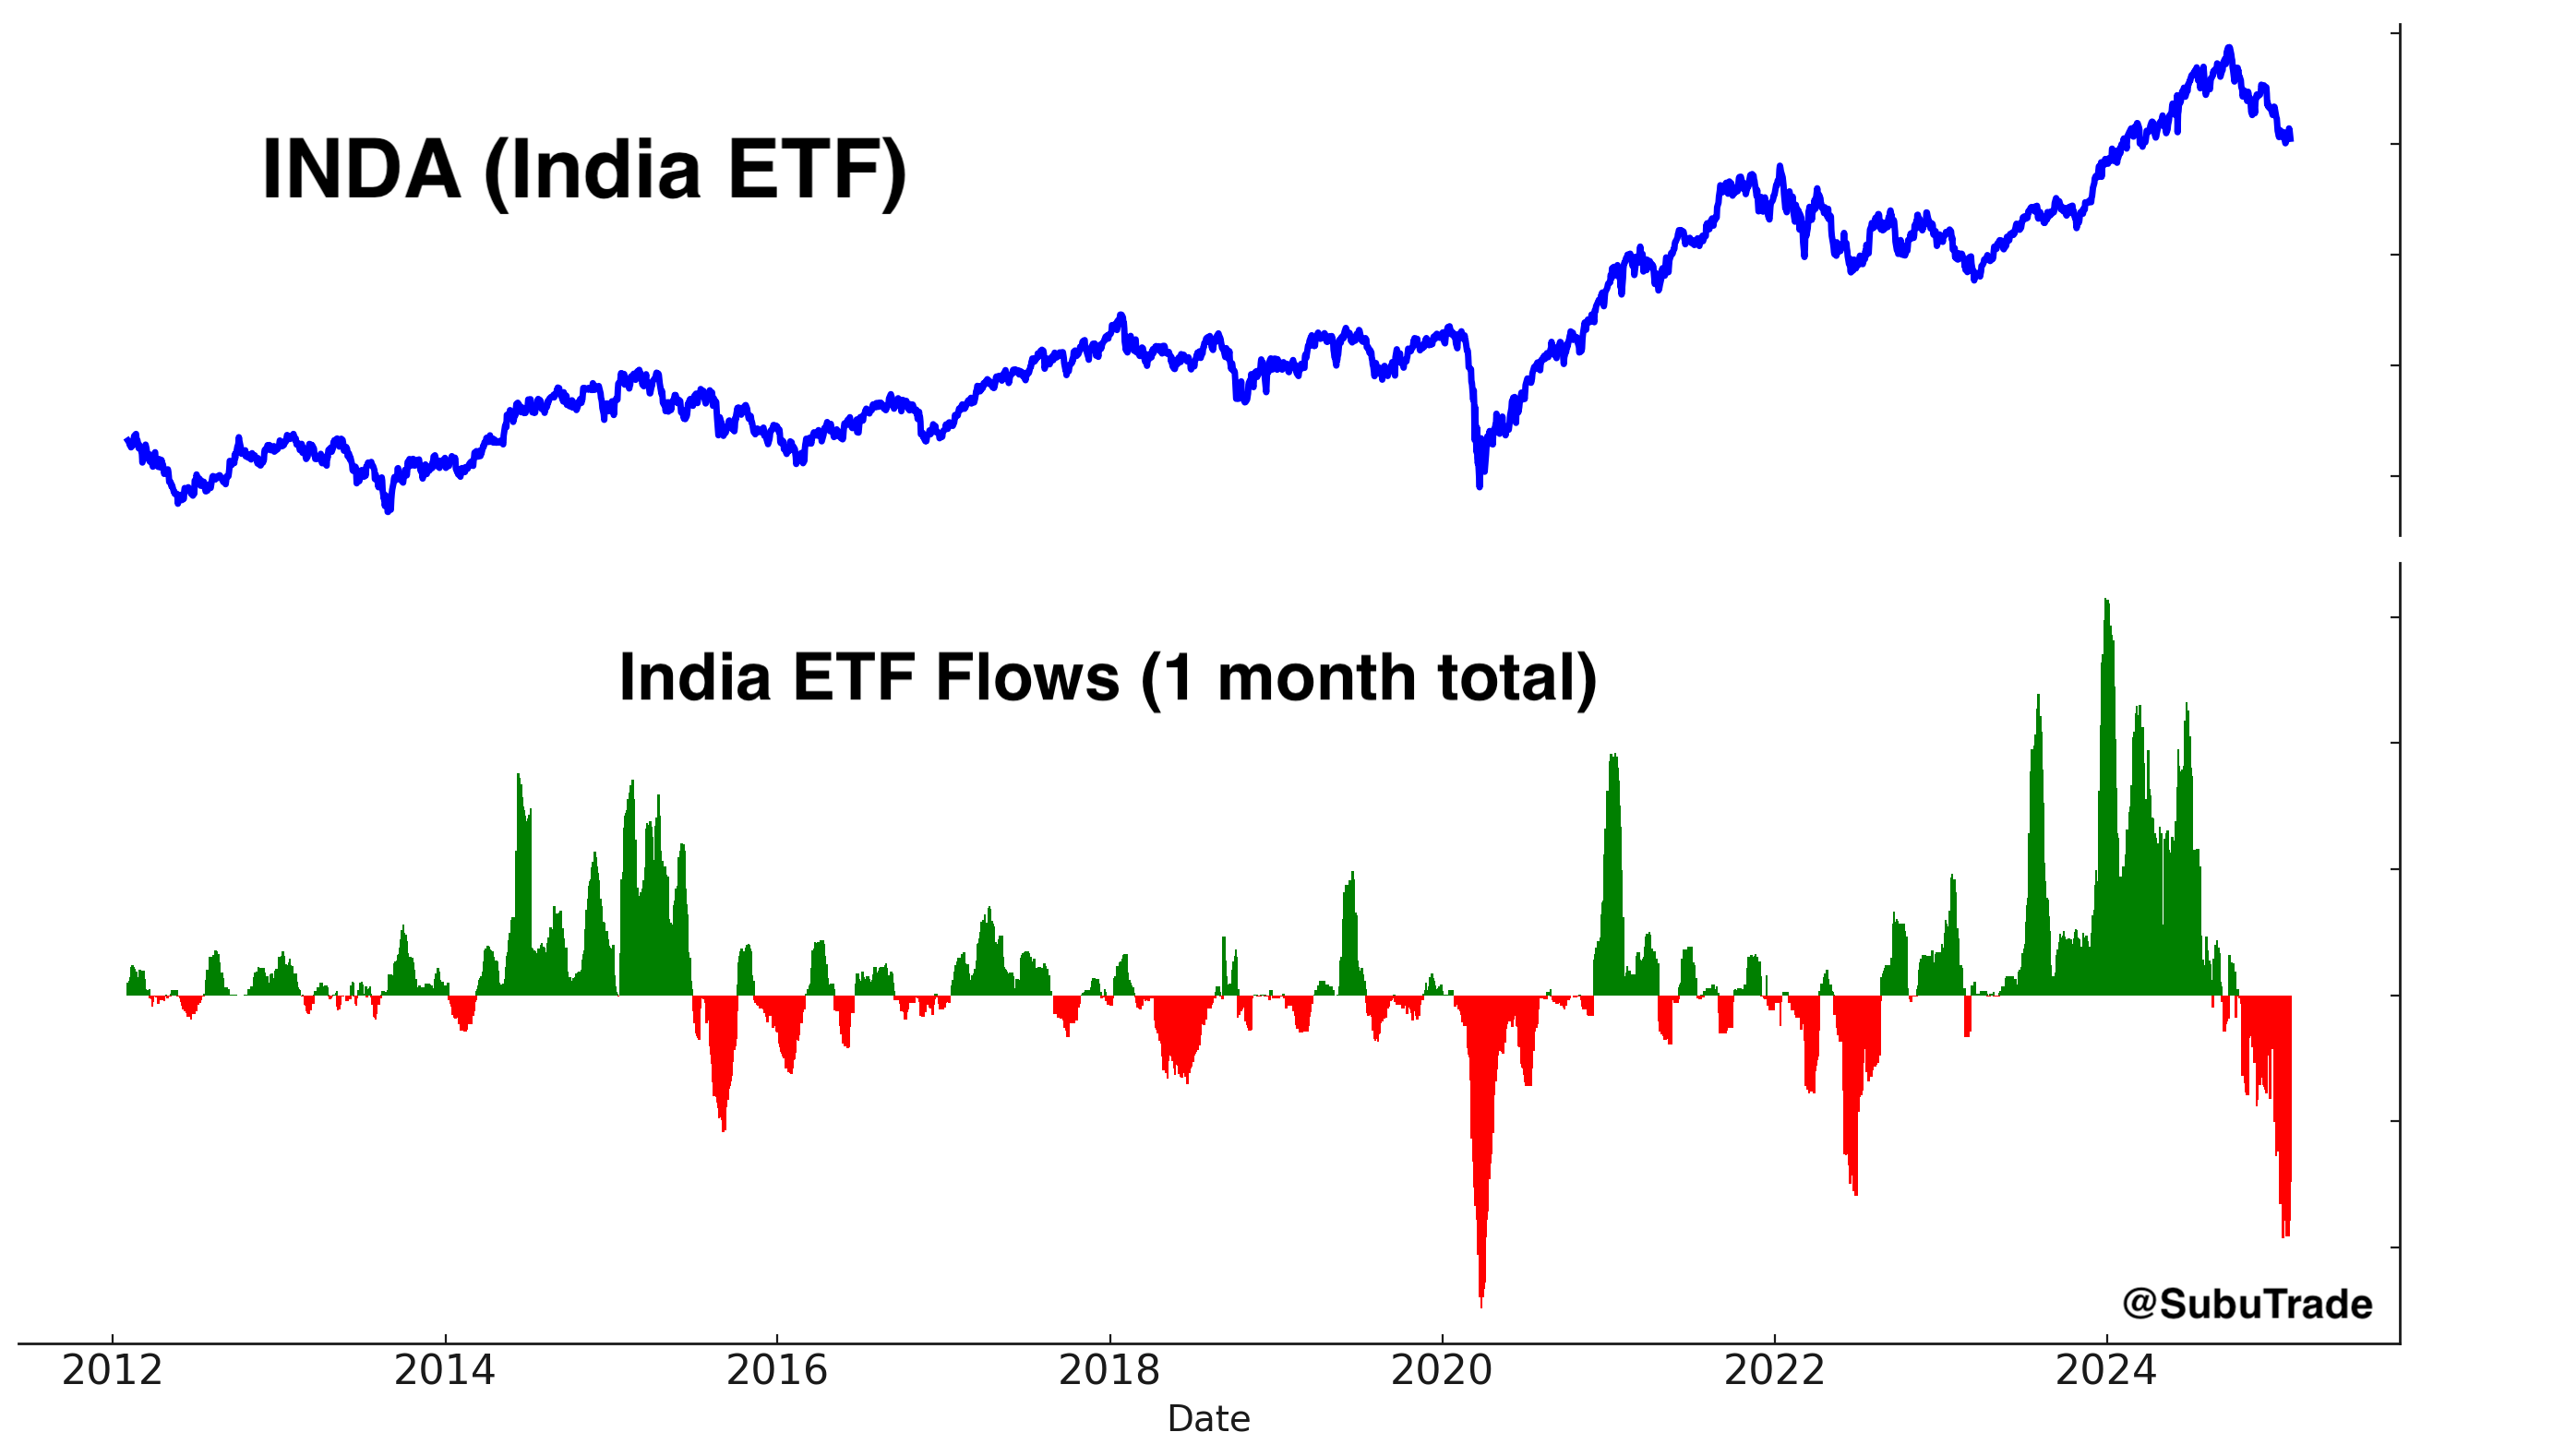
India
India remains my favorite long term investment. We continue to see large outflows from Indian ETFs:
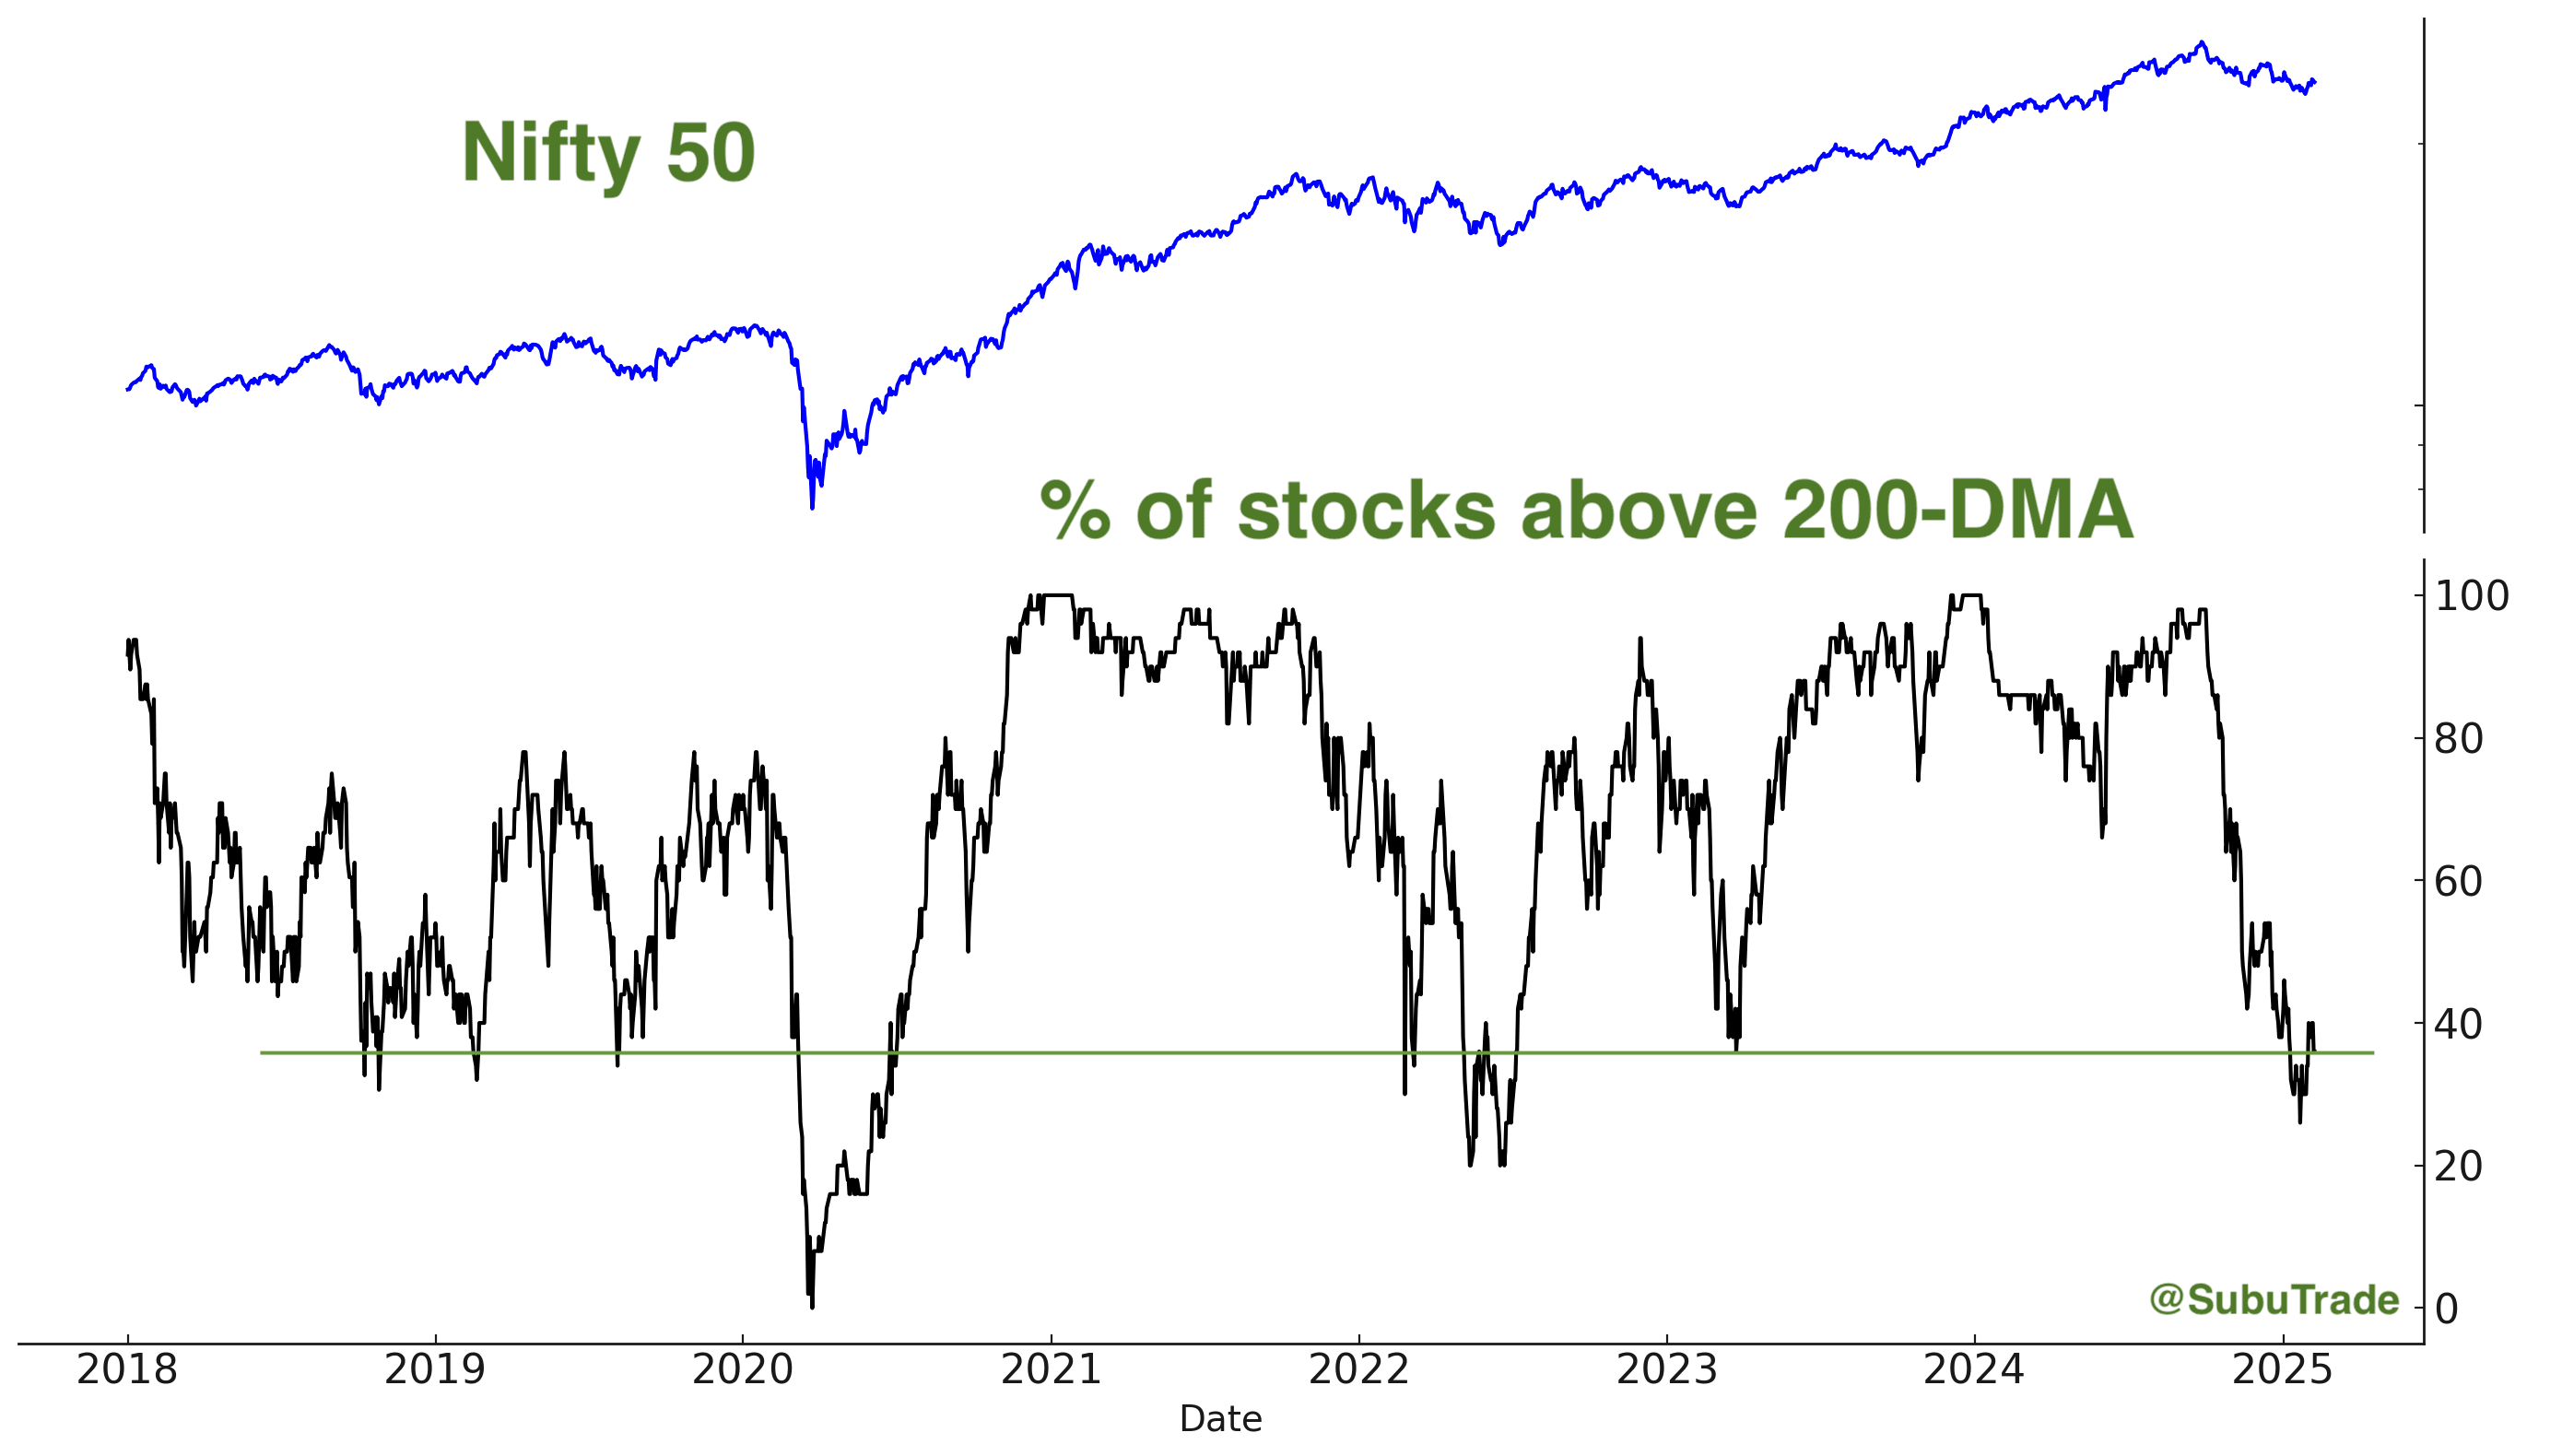
Indian breadth is so bad, that it’s bullish. Expect mean-reversion:
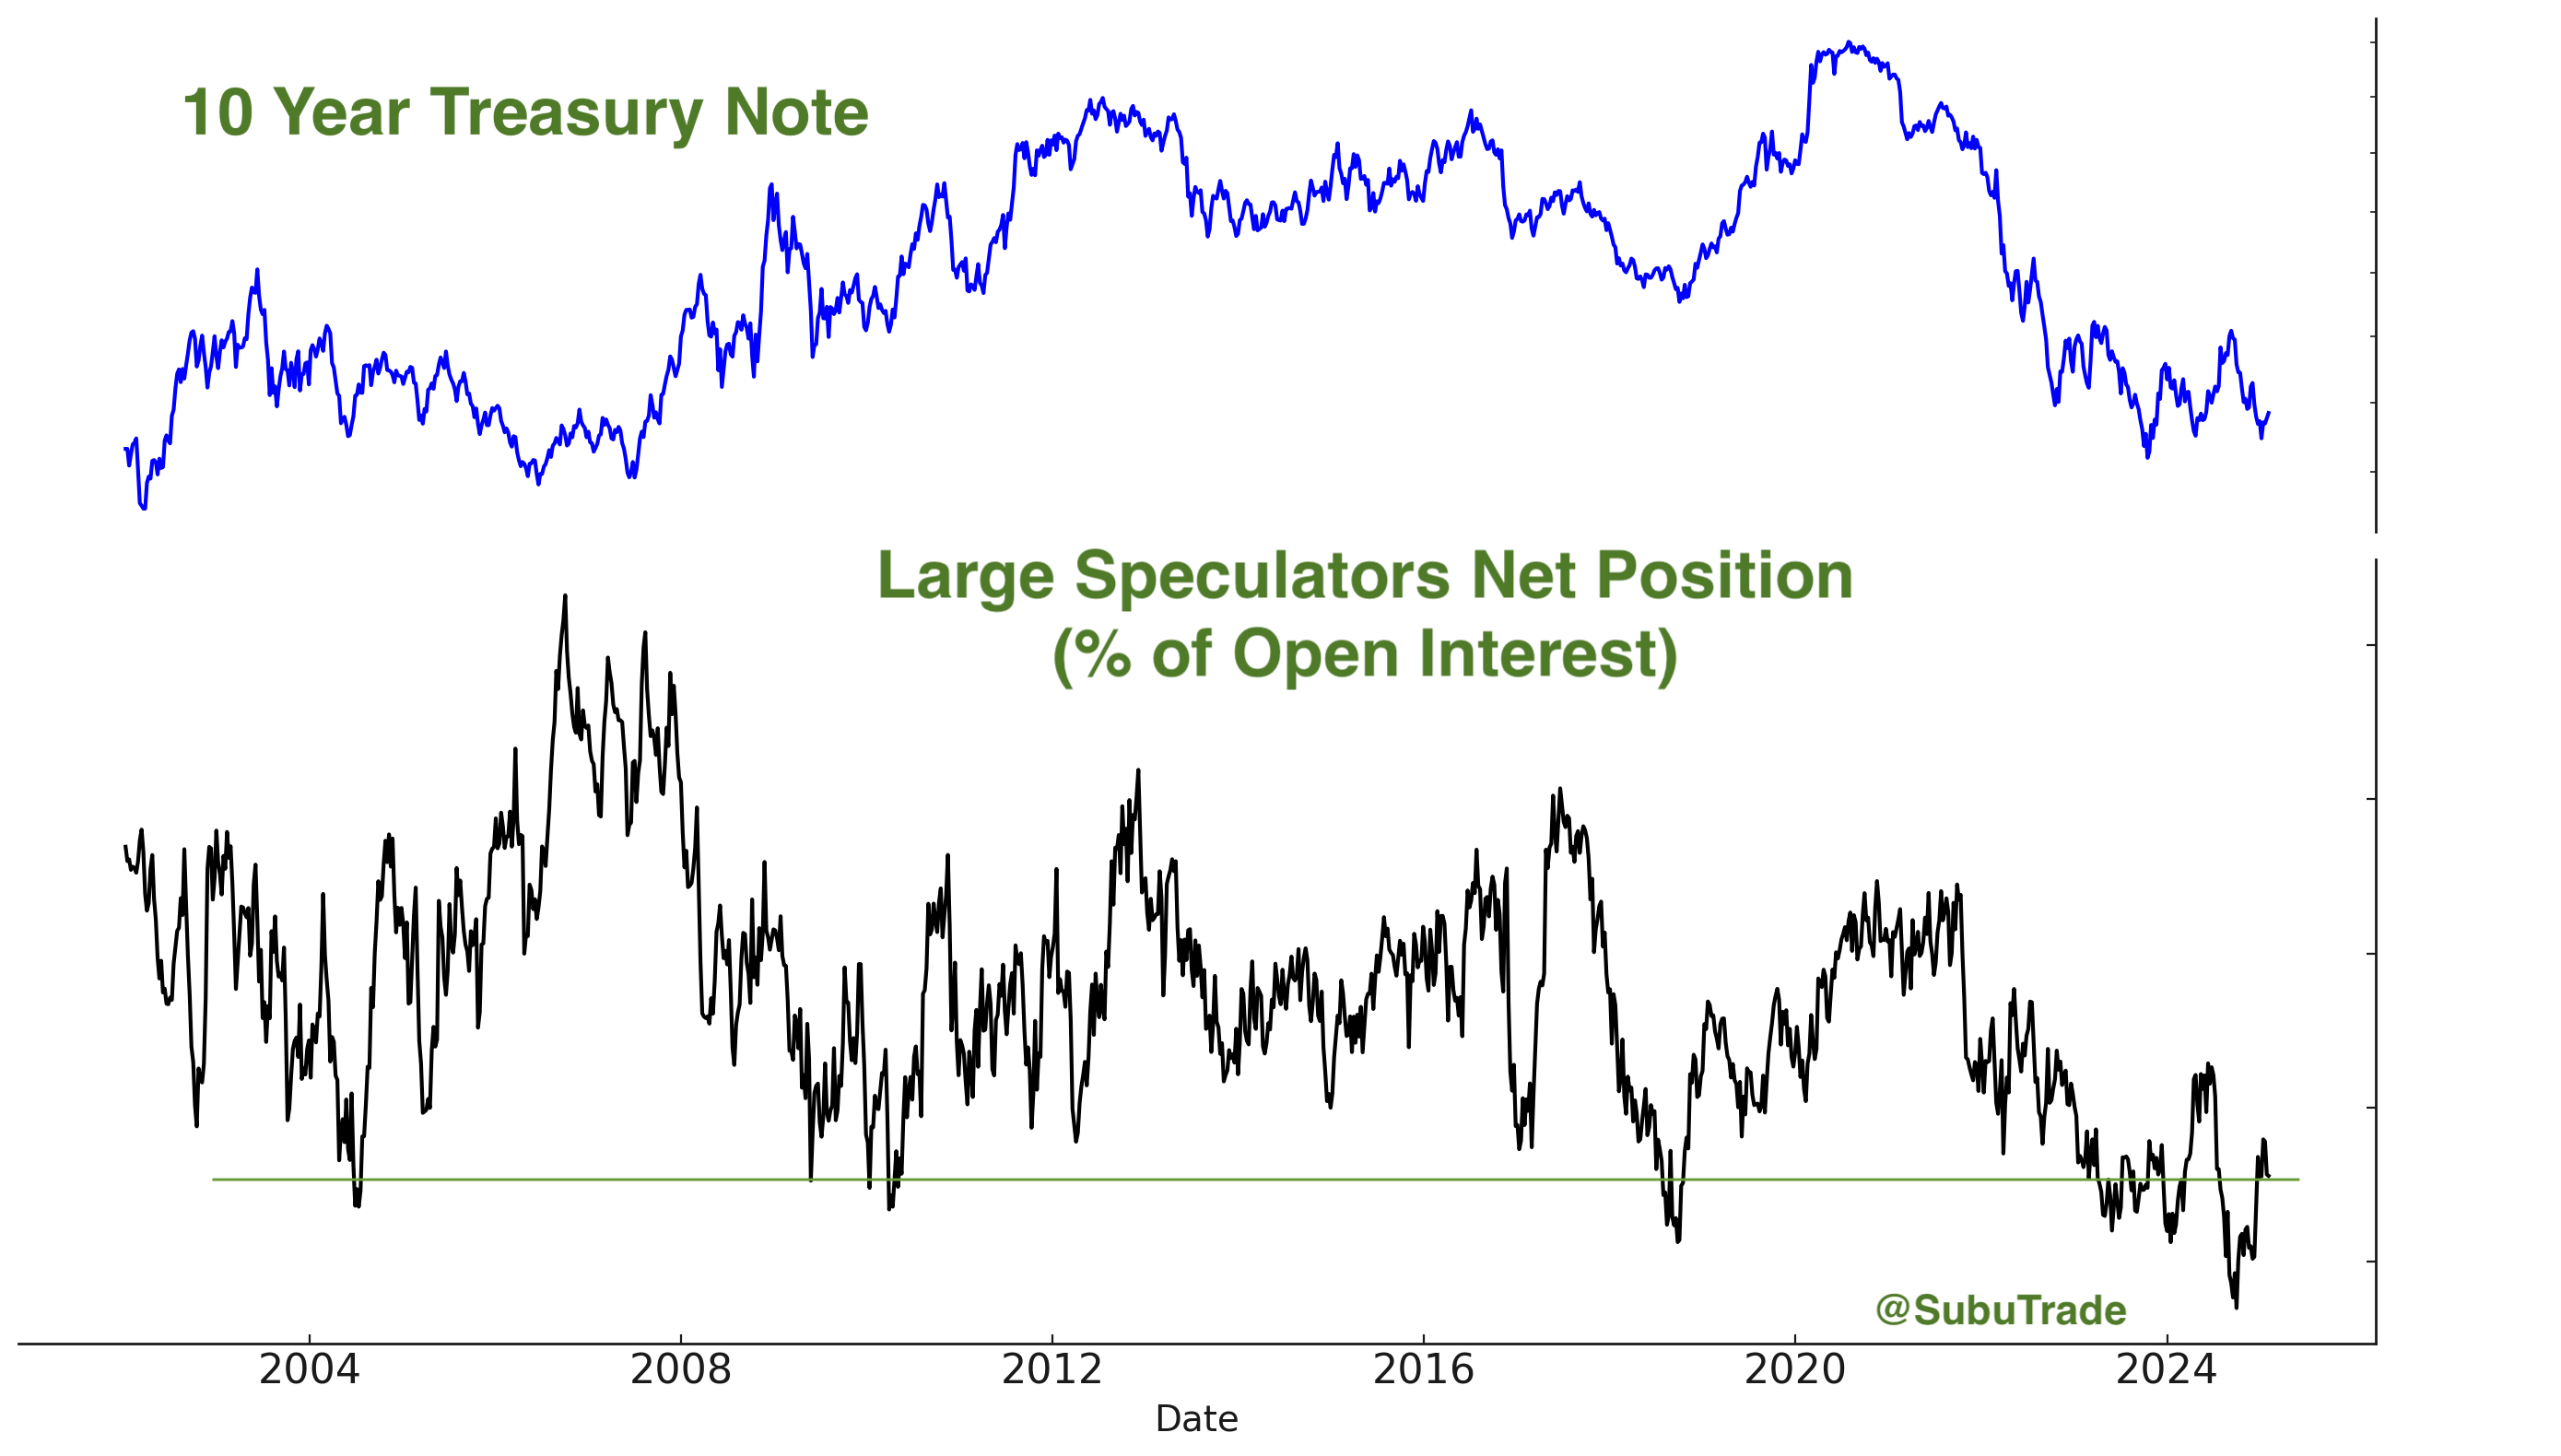
U.S. Treasury Bonds
After three years of underperformance, Treasury bonds are staging a rally. However, their gains continue to lag behind non-U.S. equities, such as Chinese stocks, and precious metals.
Here’s the 30 Year Treasury Bond’s Daily Sentiment Index. Room to push higher before this rally ends:
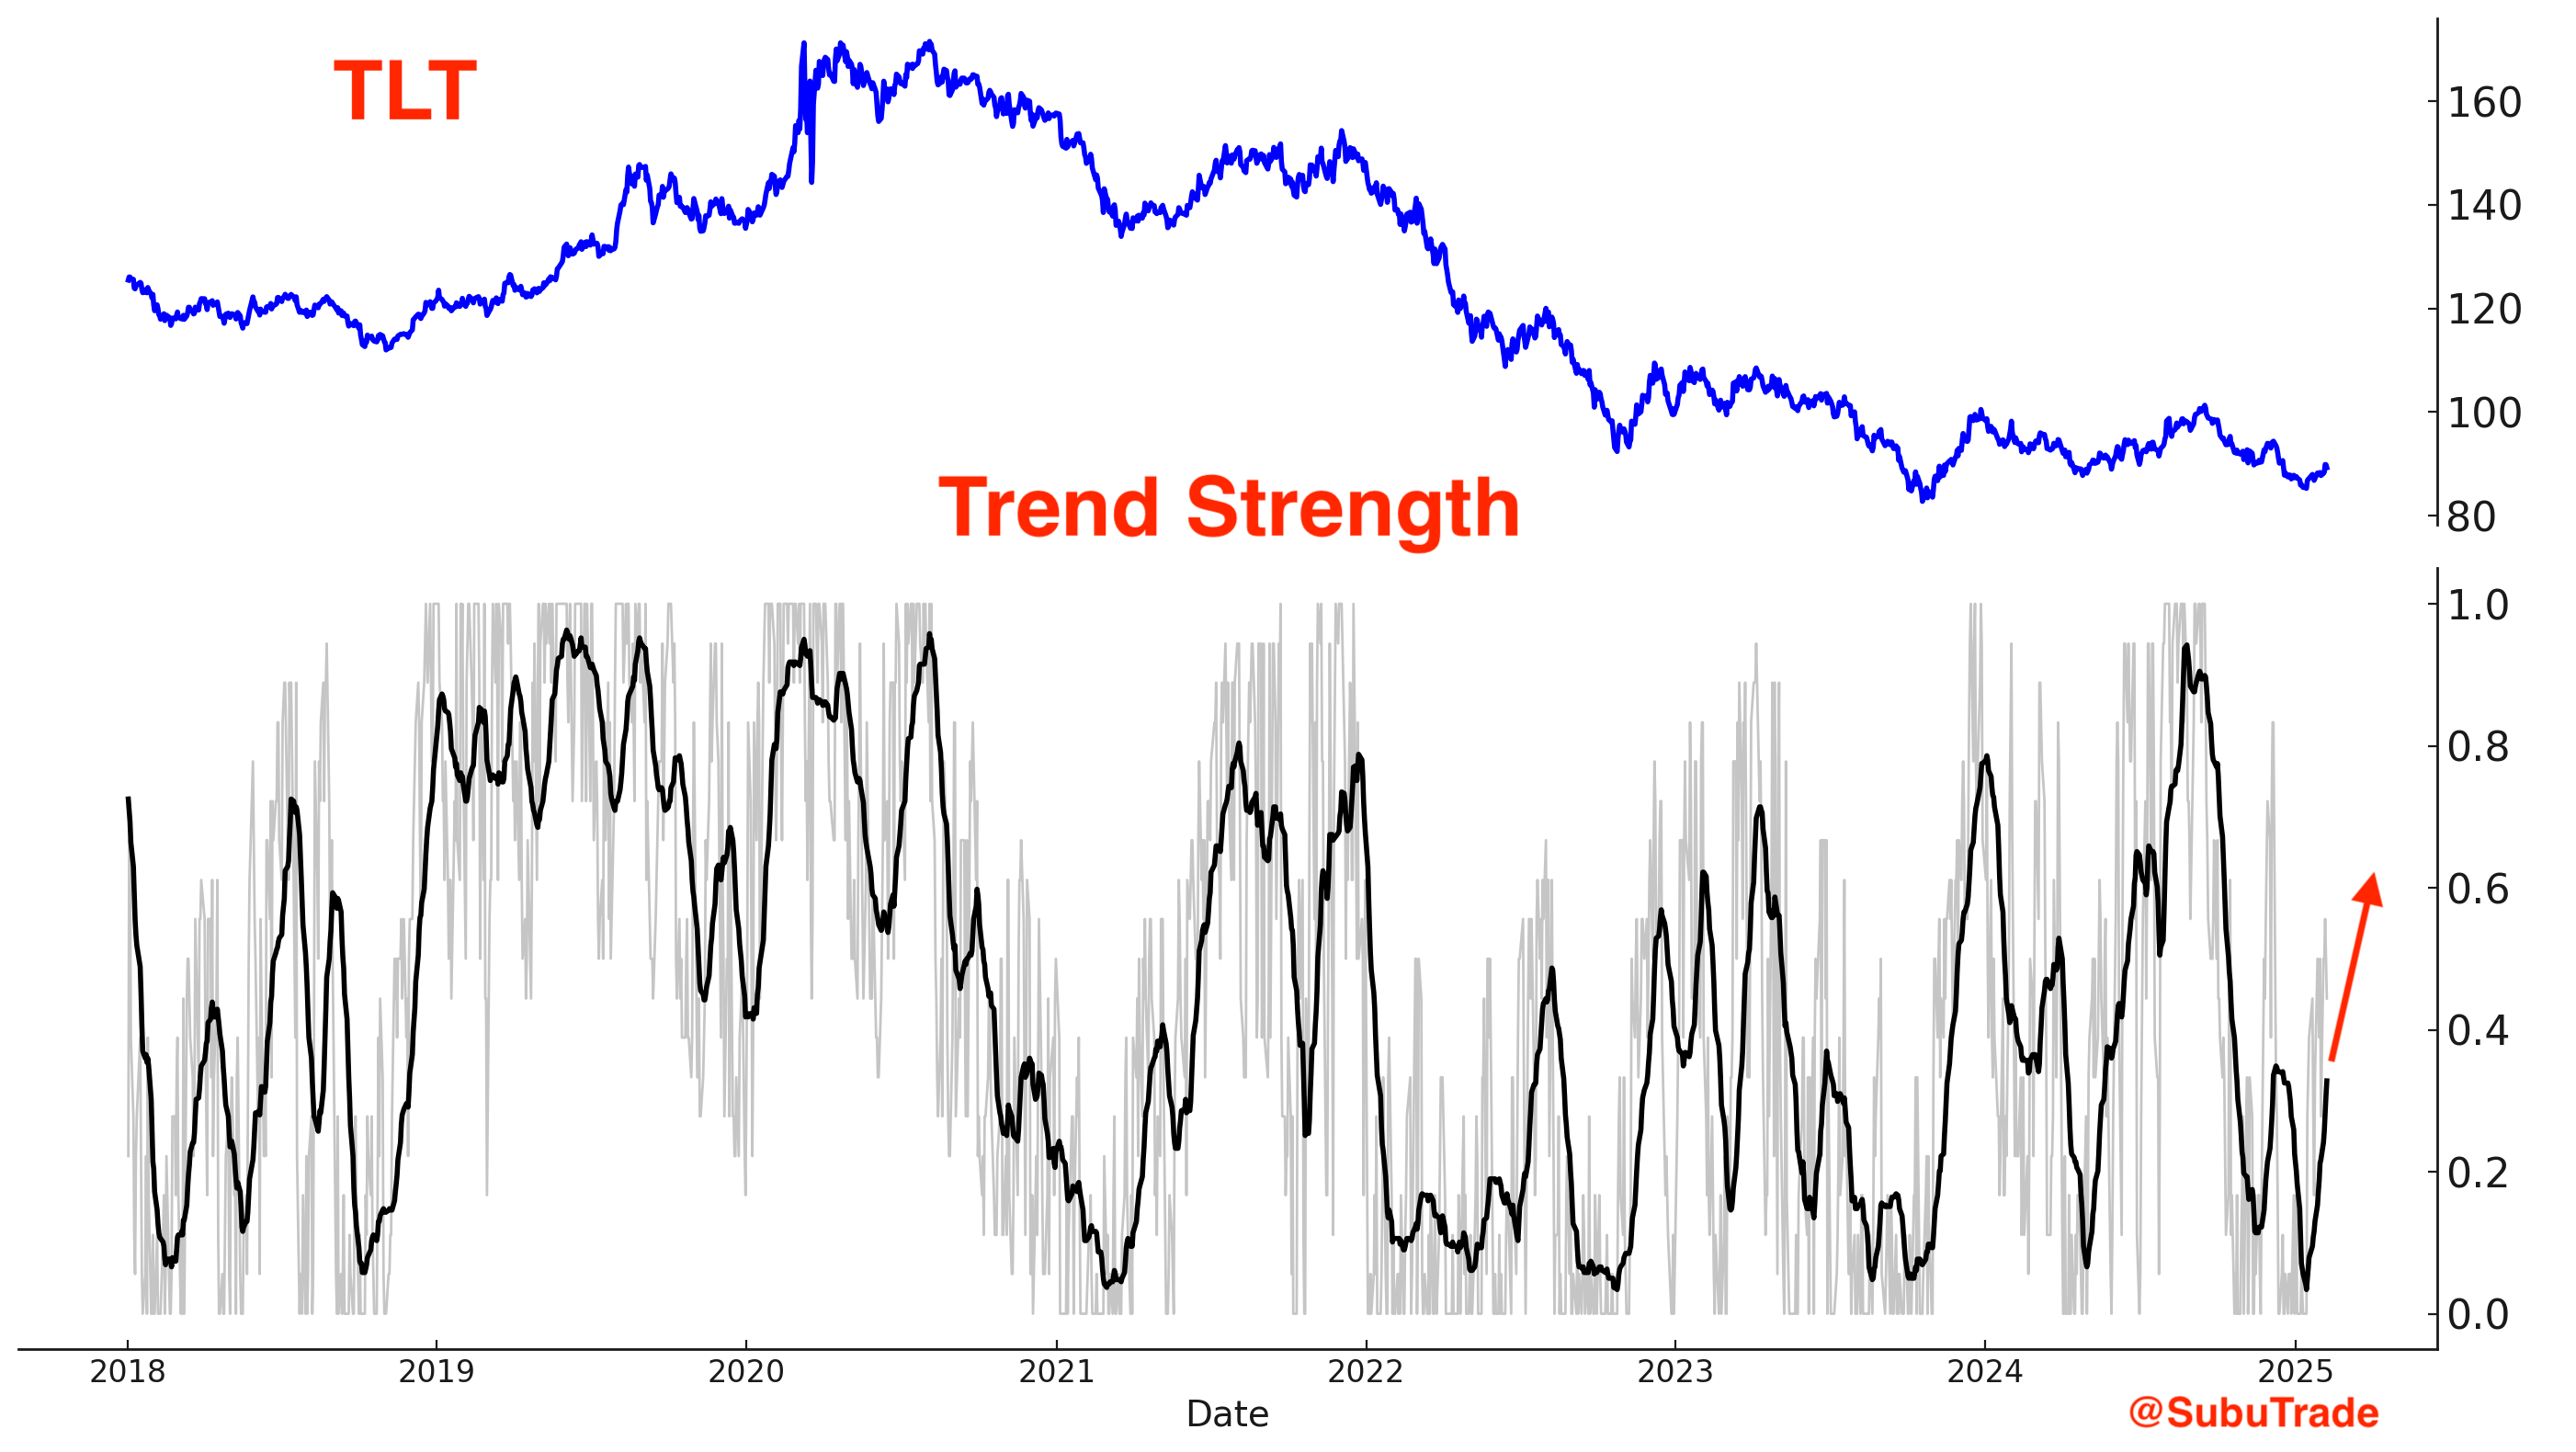
TLT’s trend is reversing upwards:
TLT fund flows are bouncing back:

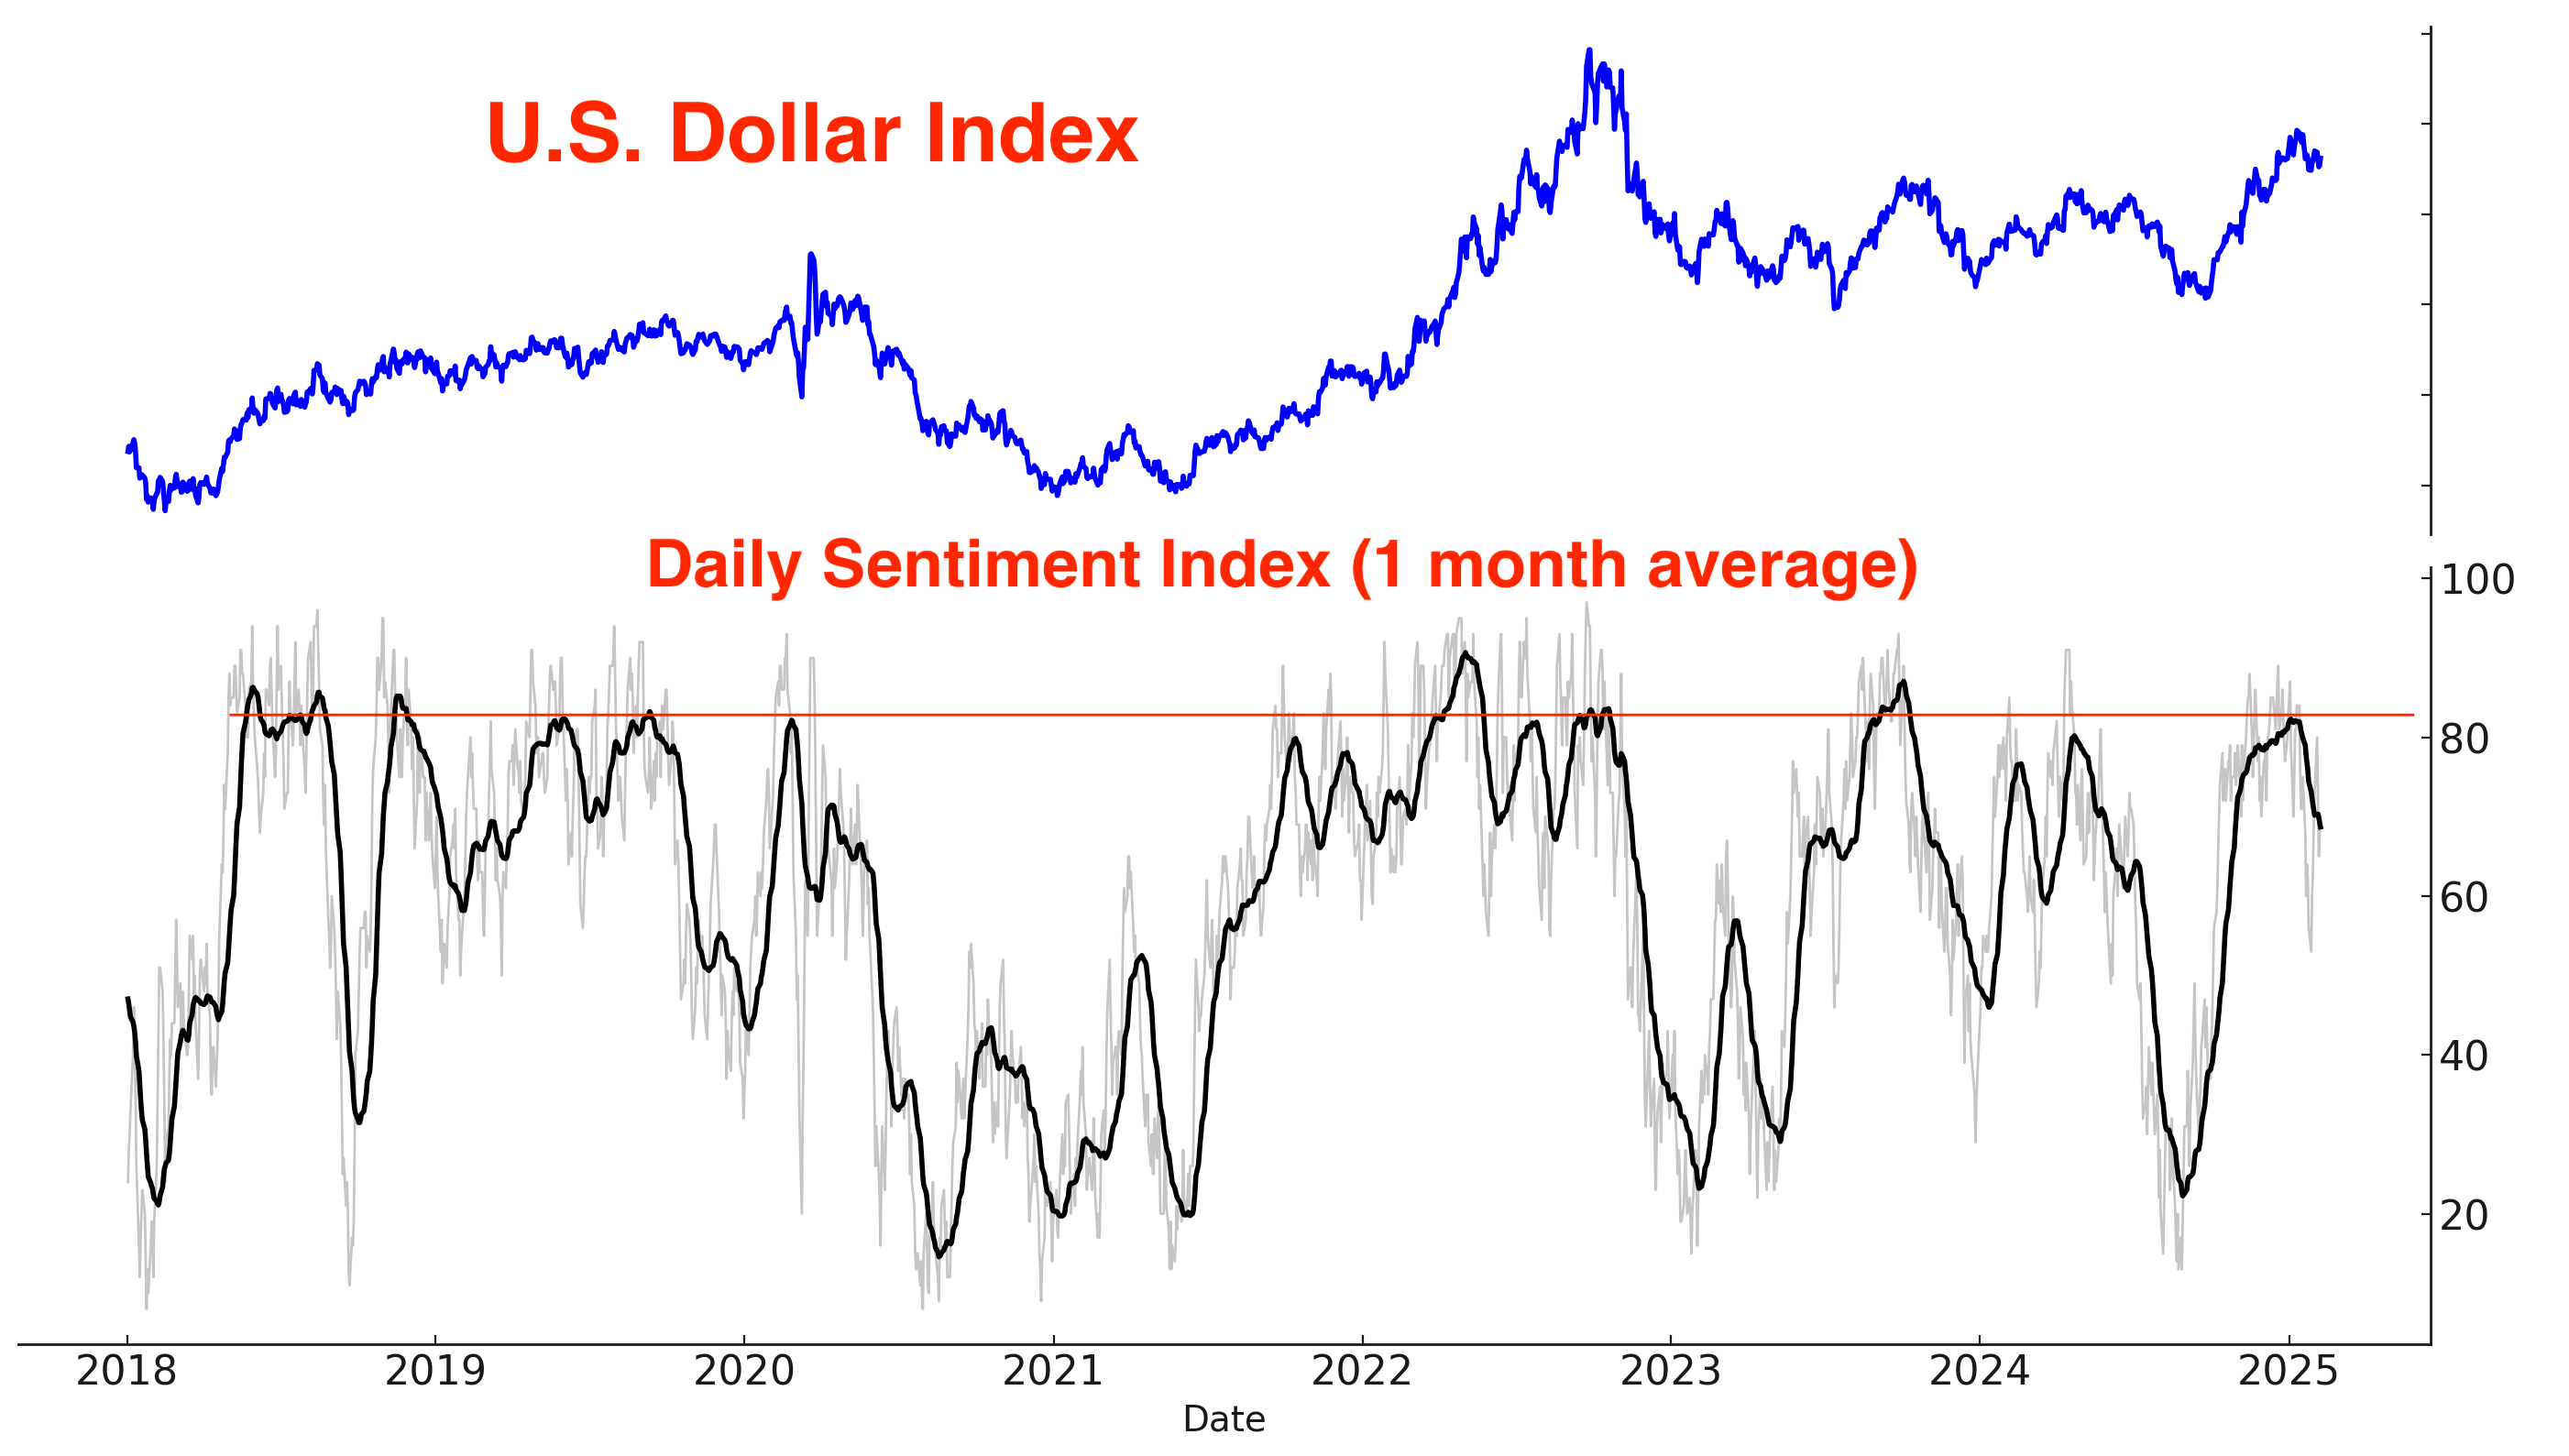
U.S. Dollar
As non-U.S. equities, gold, and bonds experience a strong rally, the U.S. dollar is undergoing a noticeable pullback. The Dollar’s Daily Sentiment Index indicates further downside potential before this pullback reaches completion.
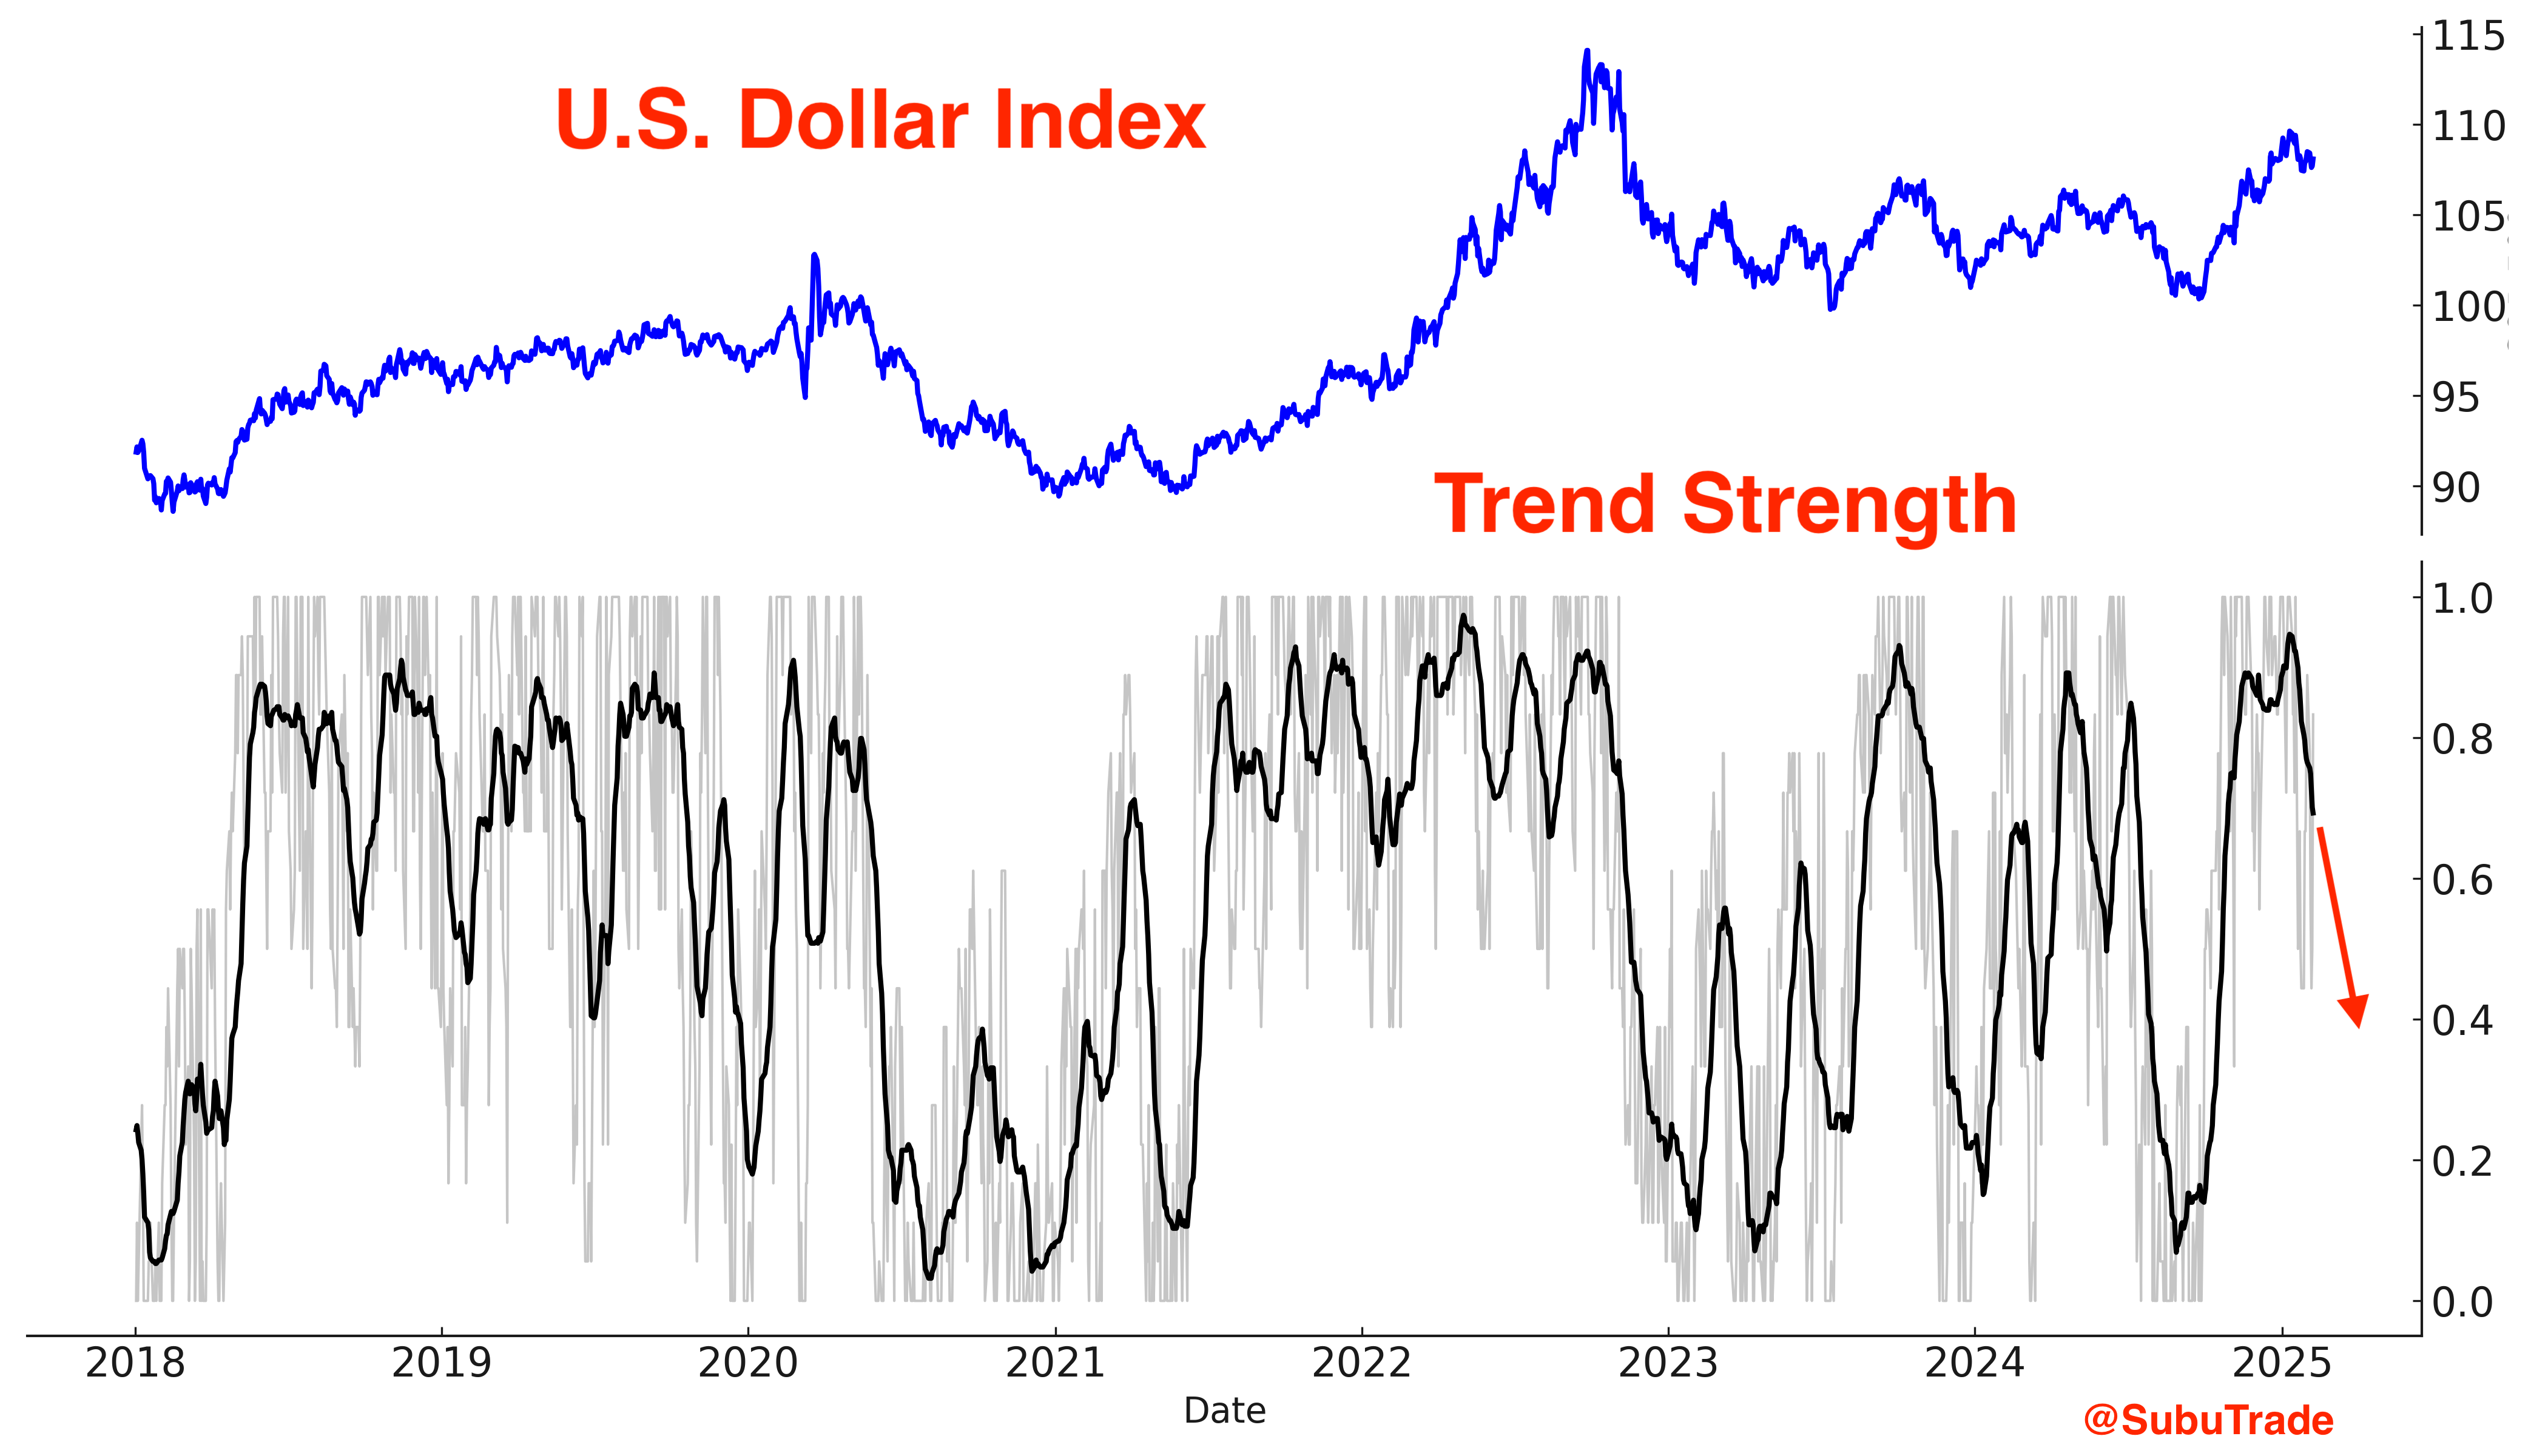
The U.S. Dollar’s trend is clearly reversing downwards:
Key Takeaways
The U.S. stock market is moving sideways, which is to be expected after a big 2 year rally (2023-2024).
As long as U.S. equities avoid a major downturn, other asset classes—such as international equities, commodities, bonds, and the U.S. dollar—have room to develop their own trends. Each market is currently responding to distinct macroeconomic themes.
Over the past two years, simply buying U.S. stocks was a profitable strategy for most investors. However, that approach is unlikely to be as effective this year. To succeed in the current market environment, traders must shift their focus to emerging opportunities beyond U.S. equities.
Thanks for reading, and if you have any questions, feel free to email me at contact@subutrade.com
Subu, how are you participating in India market? Are you concerned about exchange rate as rupee continues to weaken against dollar over time?