Markets Report: did the stock market already bottom?
Did the U.S. stock market already bottom? Plus BIG opportunities in bonds, currencies, commodities, and ex-U.S.
Everything is influenced by U.S. interest rates right now:
When rates went up, stocks, precious metals, Bitcoin, and ex-U.S. currencies/stocks struggled.
Now that rates may have formed an intermediate term bottom, will stocks/metals/Bitcoin/ex-U.S. rally?
Here’s my market analysis and how I’m positioned today. If you haven’t already, click here to understand how I trade.
U.S. Stock Market
The recent stock market selloff didn’t hit “panic selling” levels. However, the market doesn’t need panic to bottom. From a risk-reward perspective, buying stocks now might not make sense—unless we consider one external factor: bonds.
The bond market is currently driving other markets. A bounce in bonds could spark a recovery in stocks, Bitcoin, and precious metals, while pushing the U.S. Dollar lower.
Here are some indicators showing that the recent selloff in U.S. equities wasn’t true “panic selling.”
Option Flows
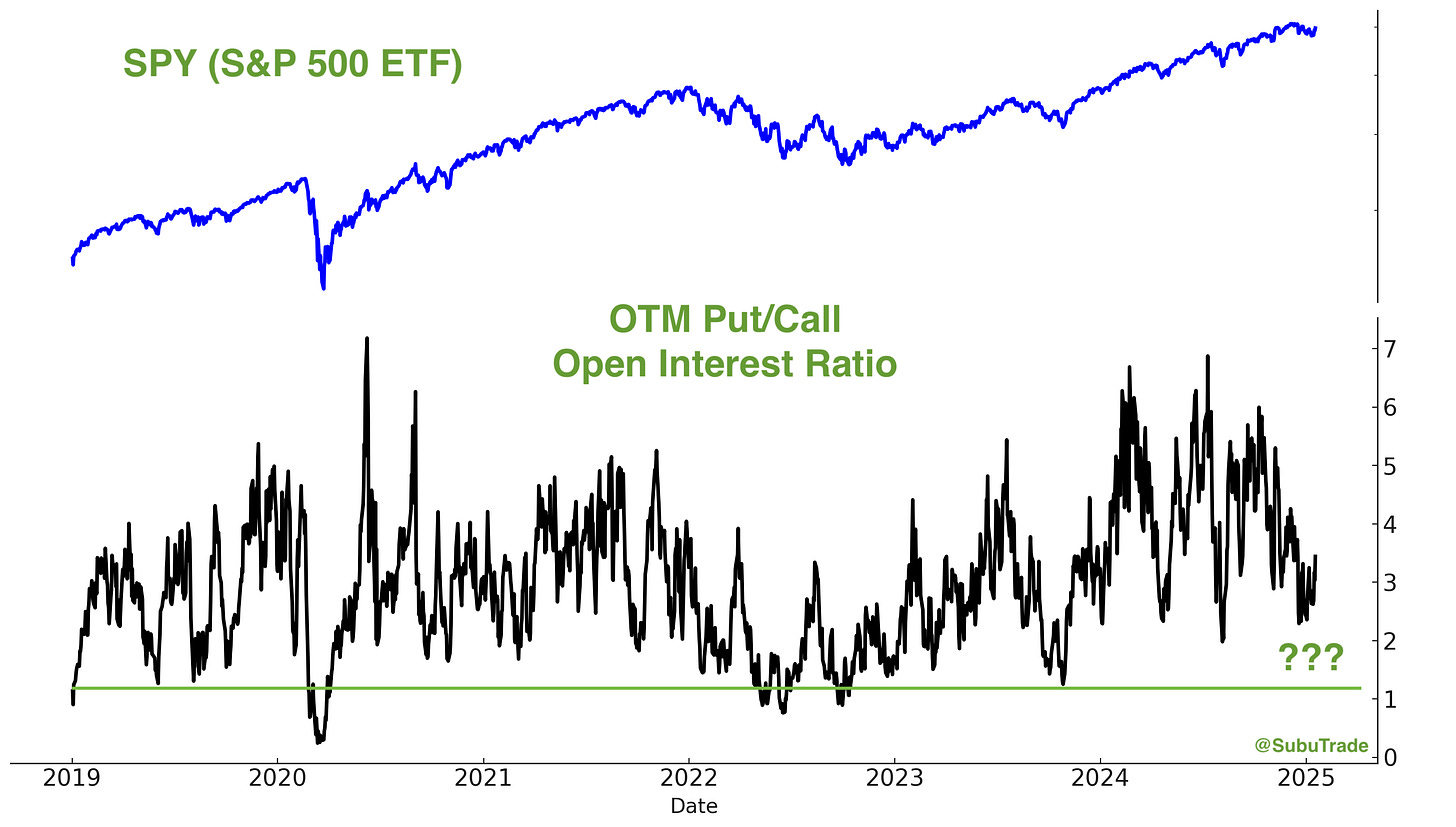
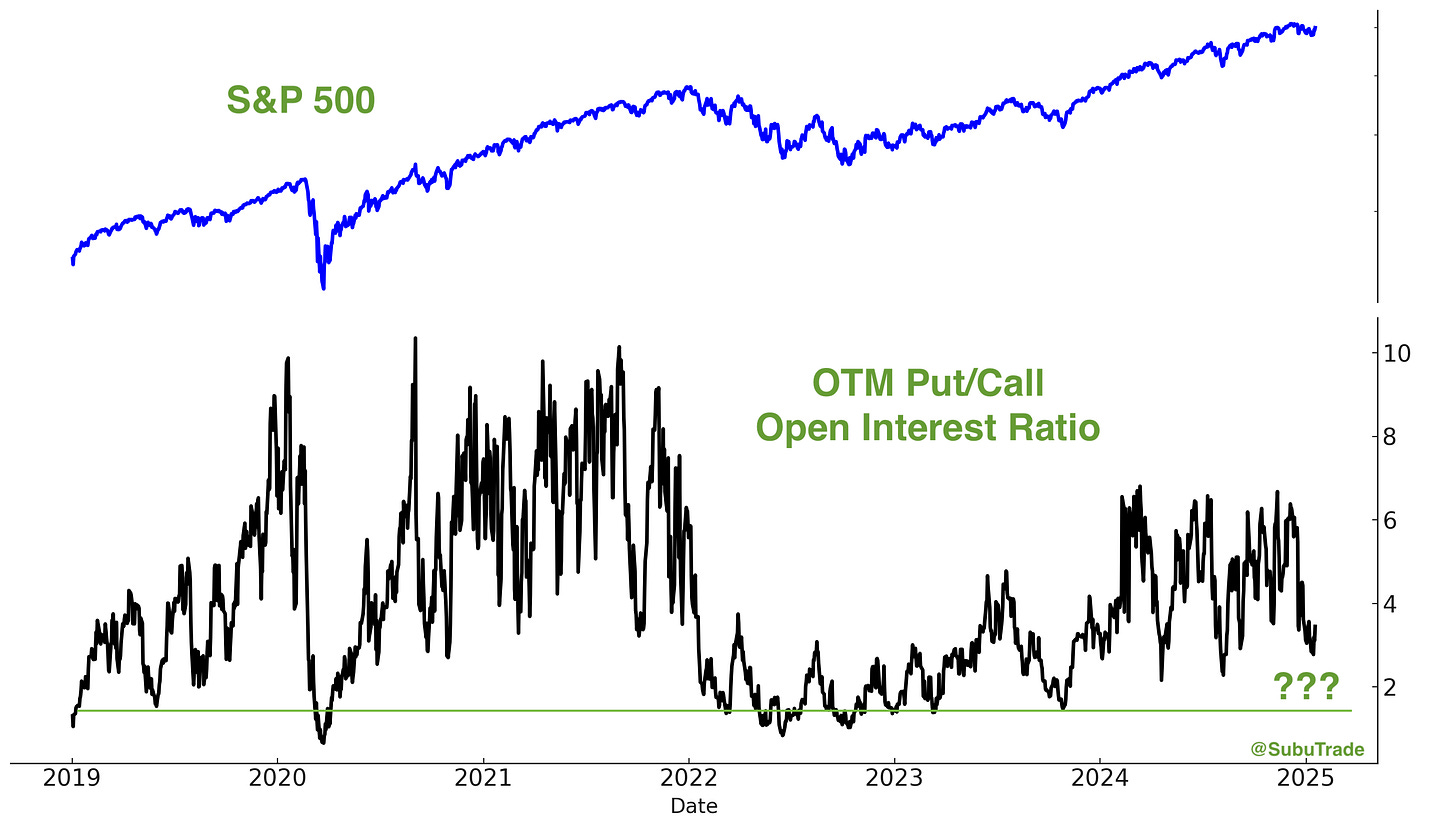
The OTM (Out of the Money) Put/Call Open Interest Ratio tracks who is losing money right now: put buyers or call buyers. This Ratio goes up when the market goes up, and goes down when the market goes down.
SPY’s ratio did not hit a “panic bottom”. In other words, the recent selloff did not sufficiently punish bullish options traders.
The SPX OTM Put/Call Open Interest Ratio paints a similar story: it didn’t drop to levels that historically signaled strong buying opportunities for equities.
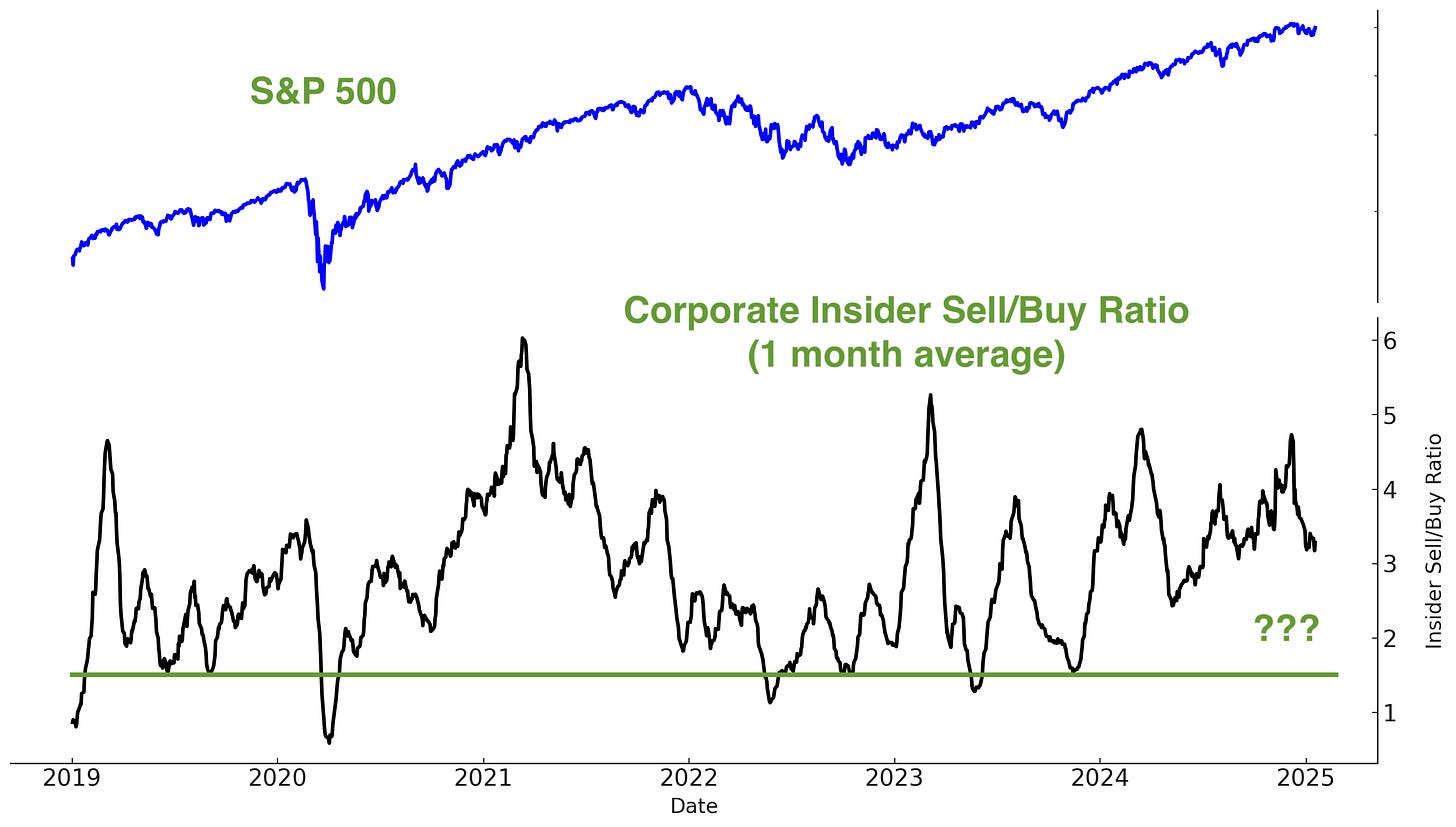
Corporate Insider Selling and Buying
Corporate insiders reduced their selling during the recent stock market pullback, but not enough to push the Insider Sell/Buy Ratio down to a level that historically, was extremely bullish for stocks.
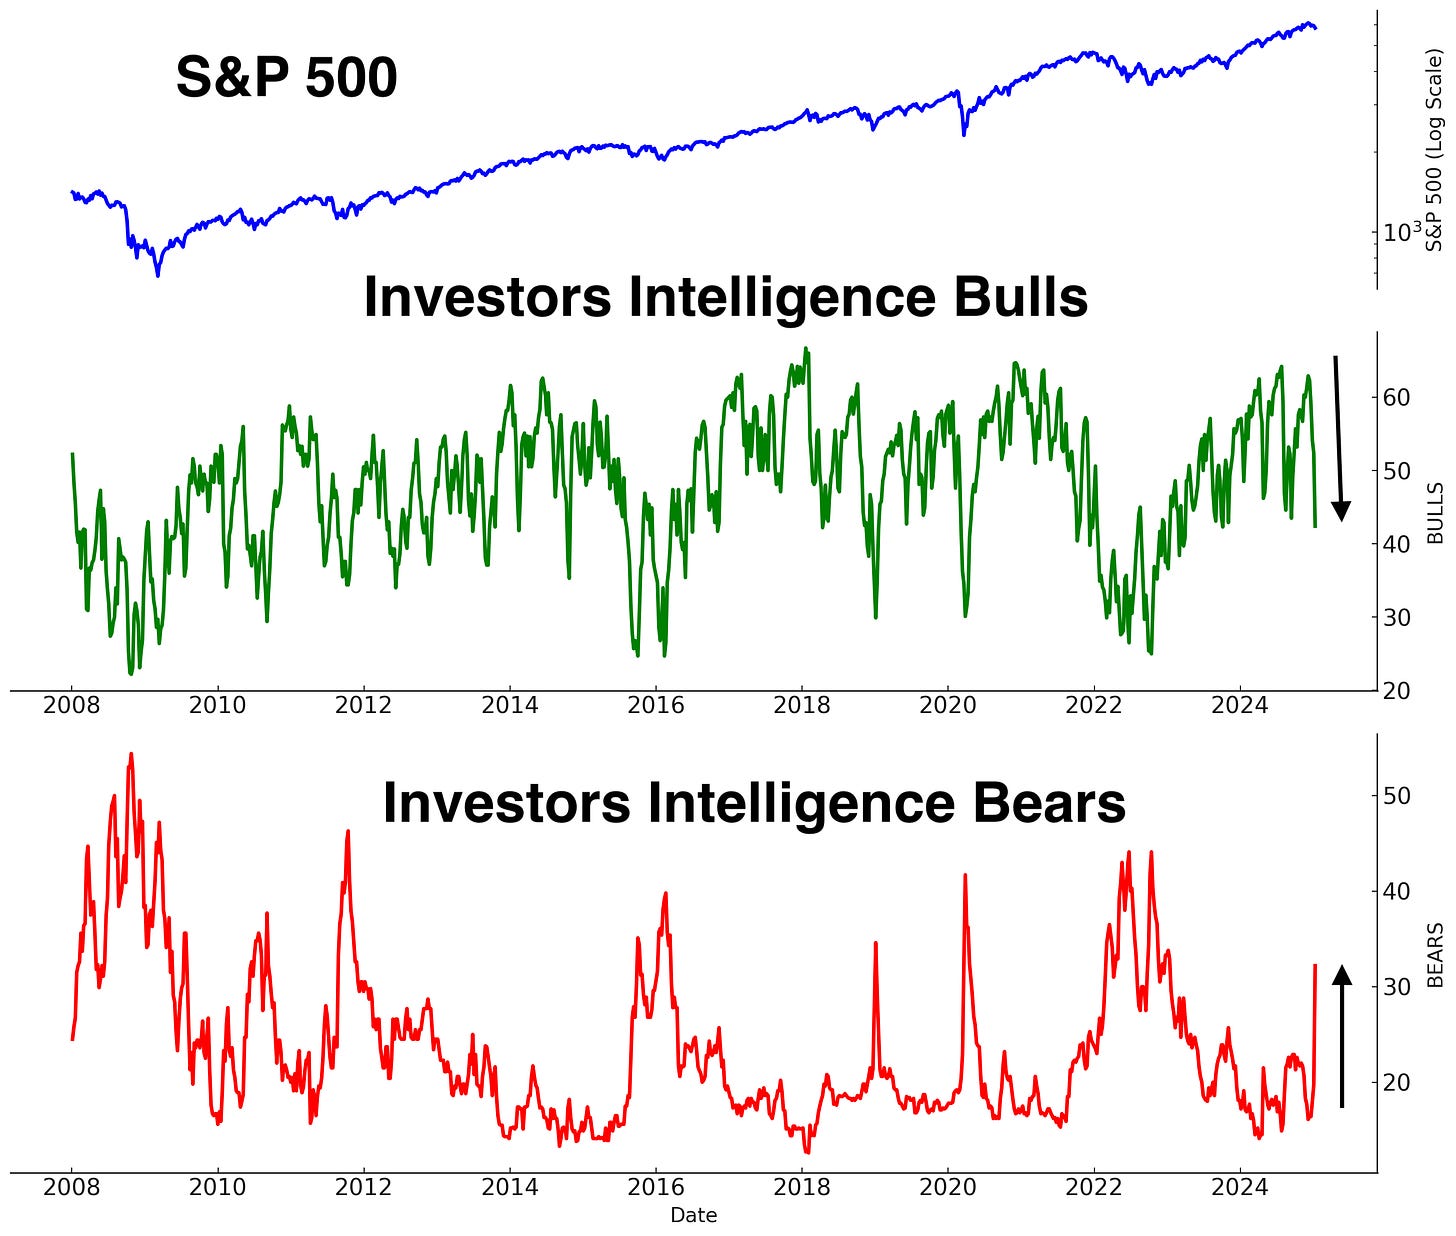
Sentiment Surveys
Sentiment took a hit during the recent selloff. The Investors Intelligence Bullish % fell and Bearish % spiked:
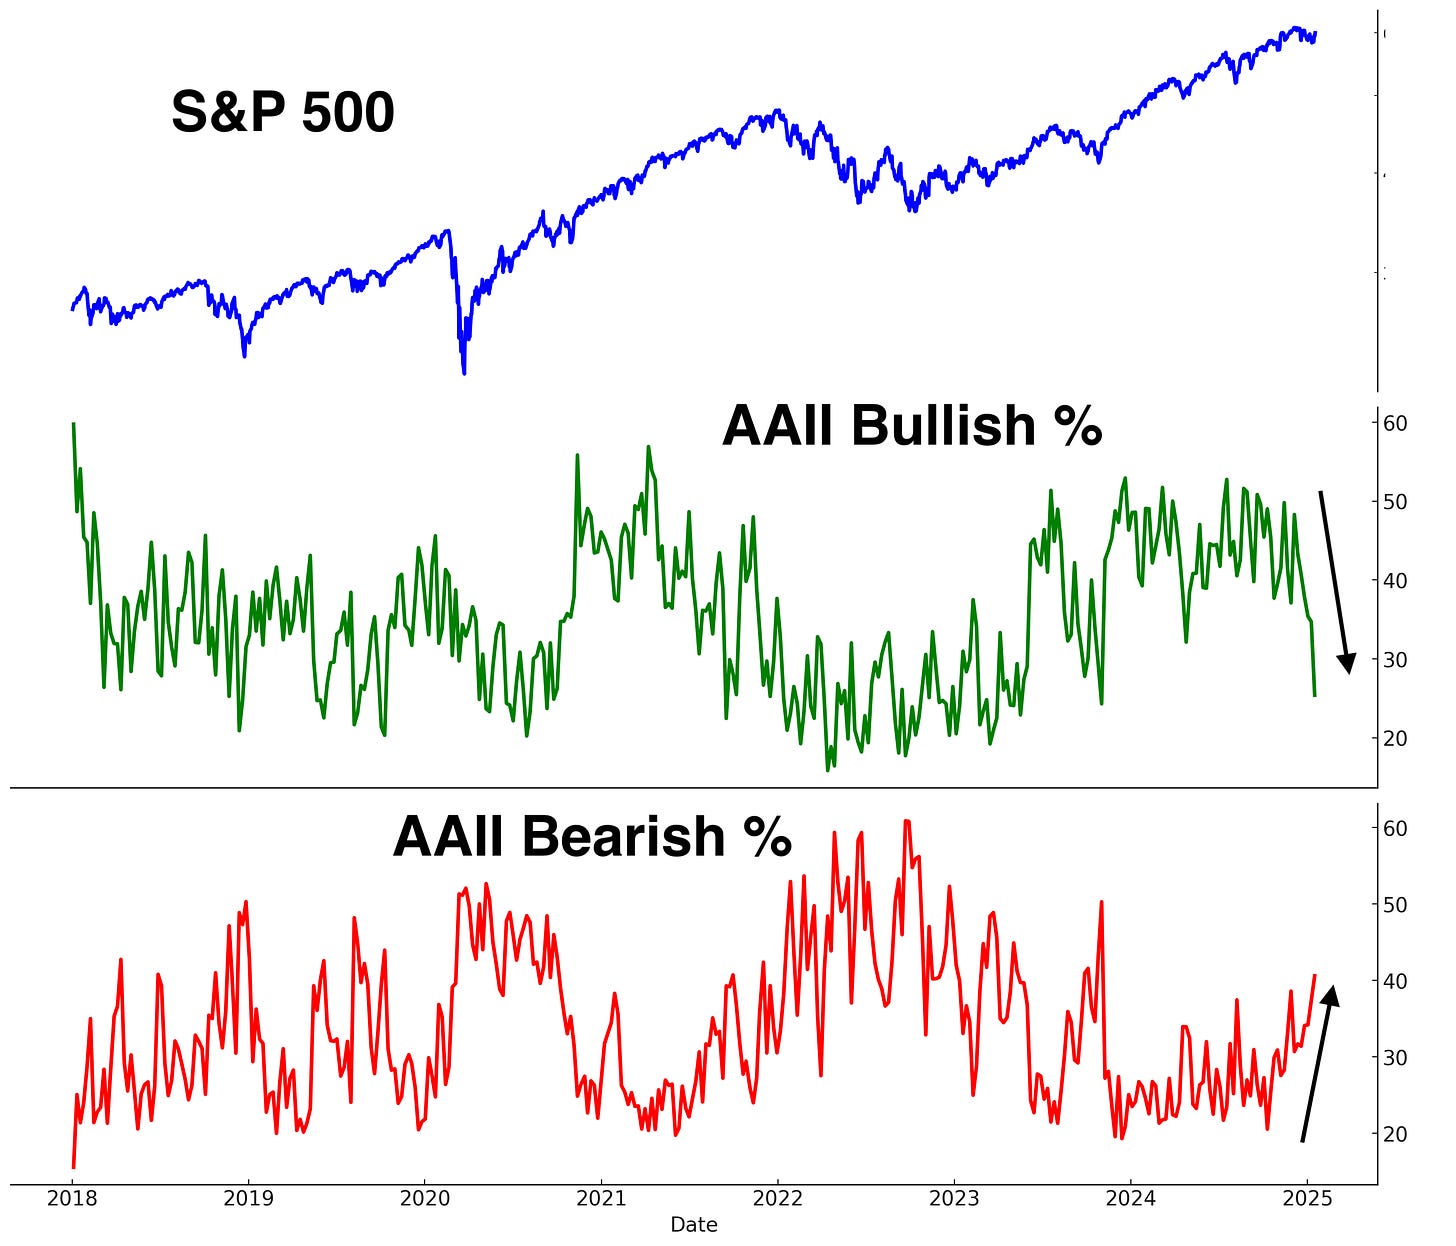
The AAII Sentiment Survey paints a similar picture:
In the 137 historical weeks when Bulls were less than 26% and Bears were more than 40%, the stock market had a tendency to rally over the next 1-2 months:
Other Sentiment Metrics
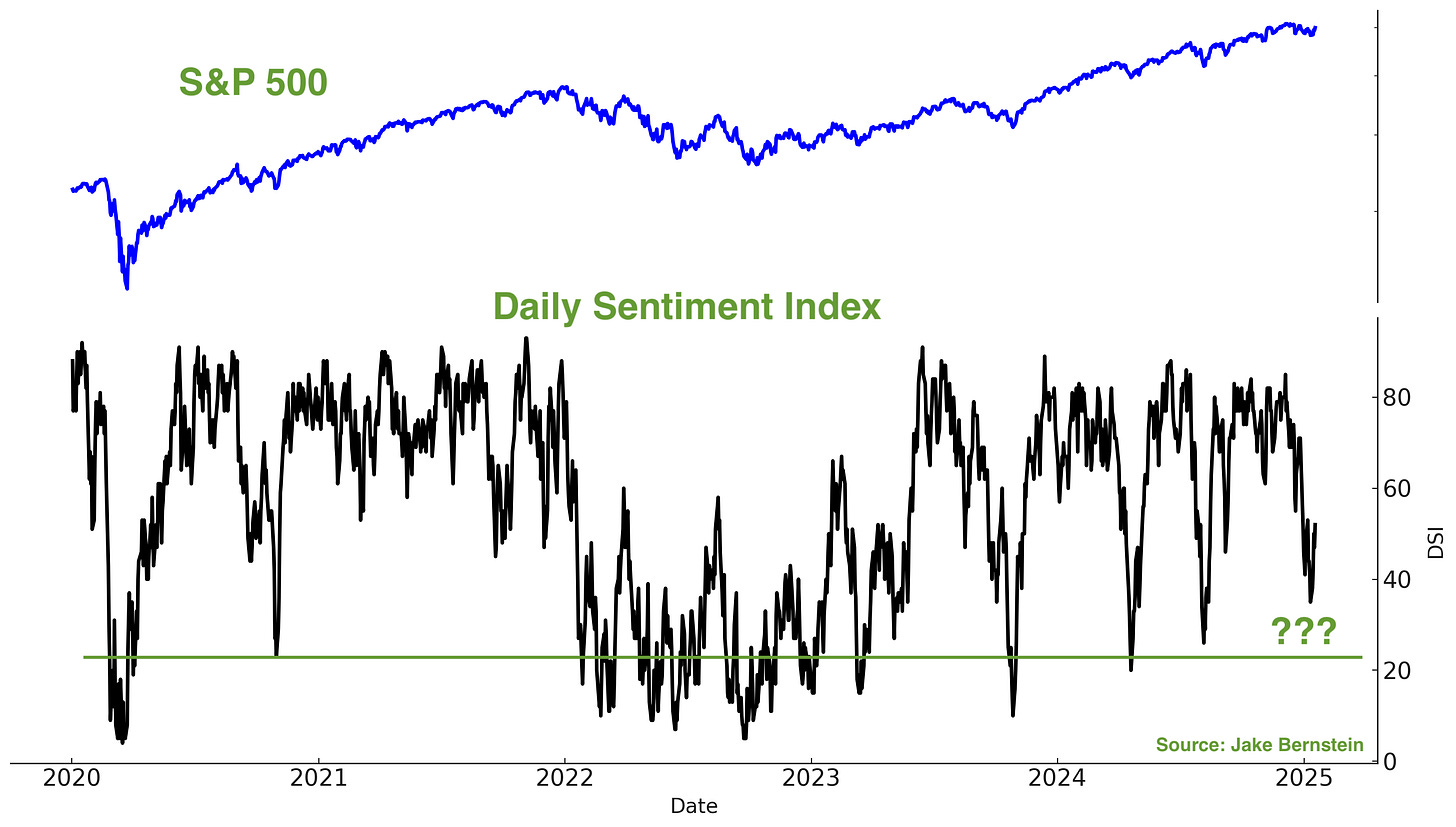
The recent pullback somewhat brought down the S&P 500’s Daily Sentiment Index:
Breadth
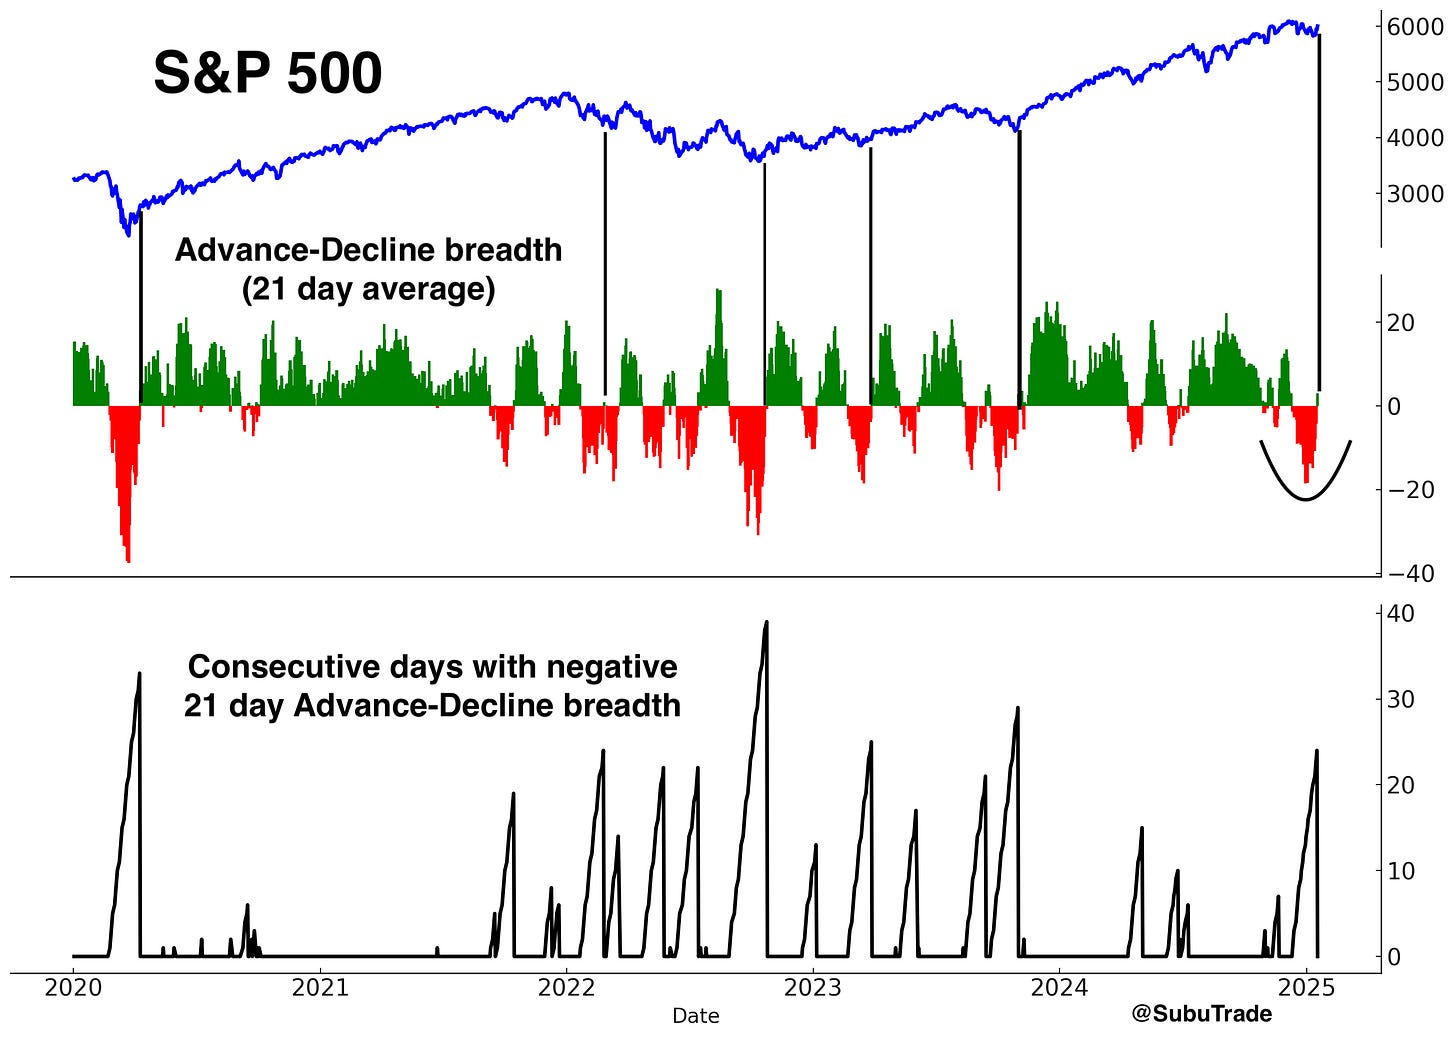
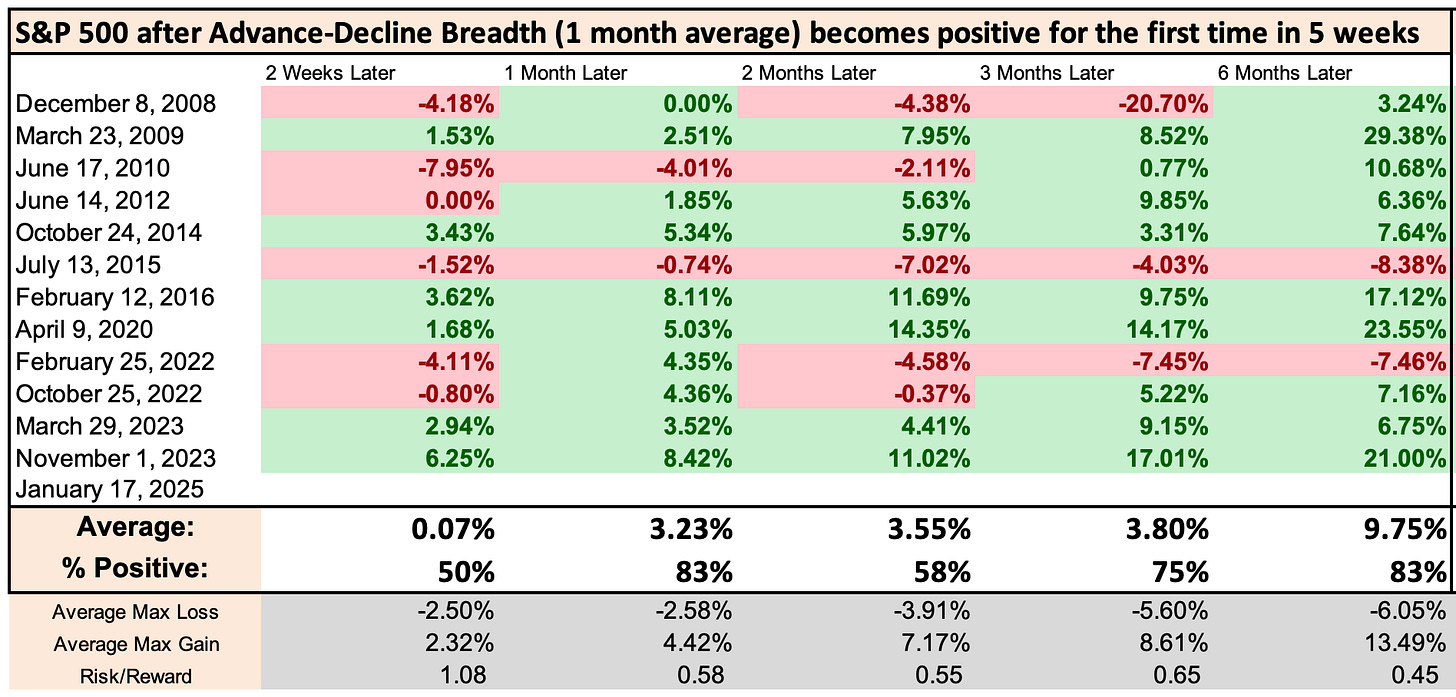
As I shared on Twitter/X, breadth is improving. The S&P 500’s Advance-Decline 21 day average became positive for the first time in 5 weeks:
Historical cases since the GFC saw stocks rally over the next month:
Energy
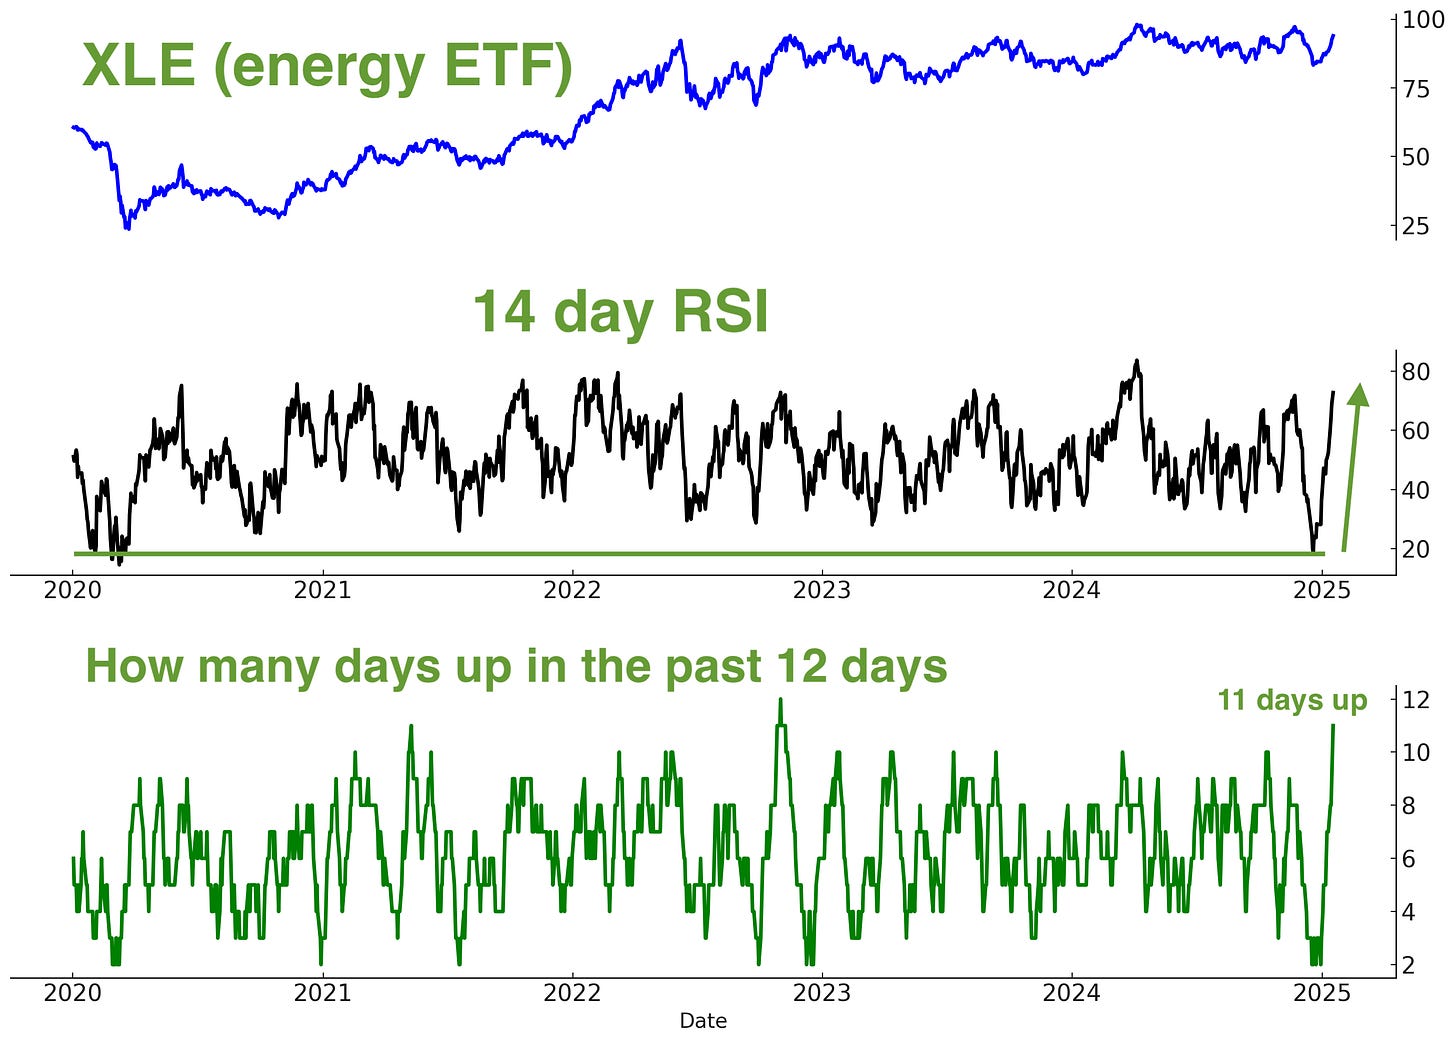
I’ve been quite bullish towards the energy sector since Christmas and took a long XLE position. This was a short term, mean-reversion position.
XLE cycled from one of its lowest RSI readings (momentum) back to overbought. In addition, XLE is up 11 out of the past 12 days. As a result, I closed that long position on Friday.
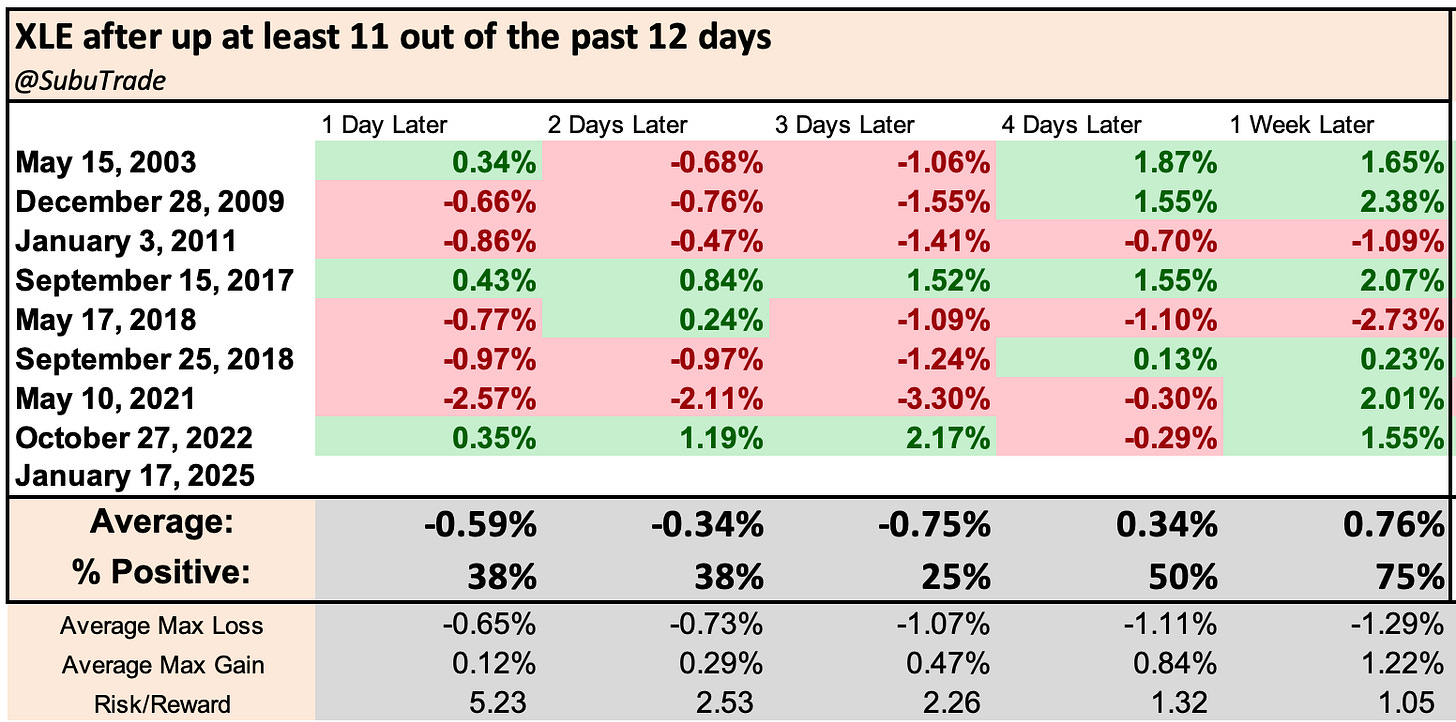
Historical cases of XLE rallying 11 out of the past 12 days usually saw XLE struggle over the next few days.
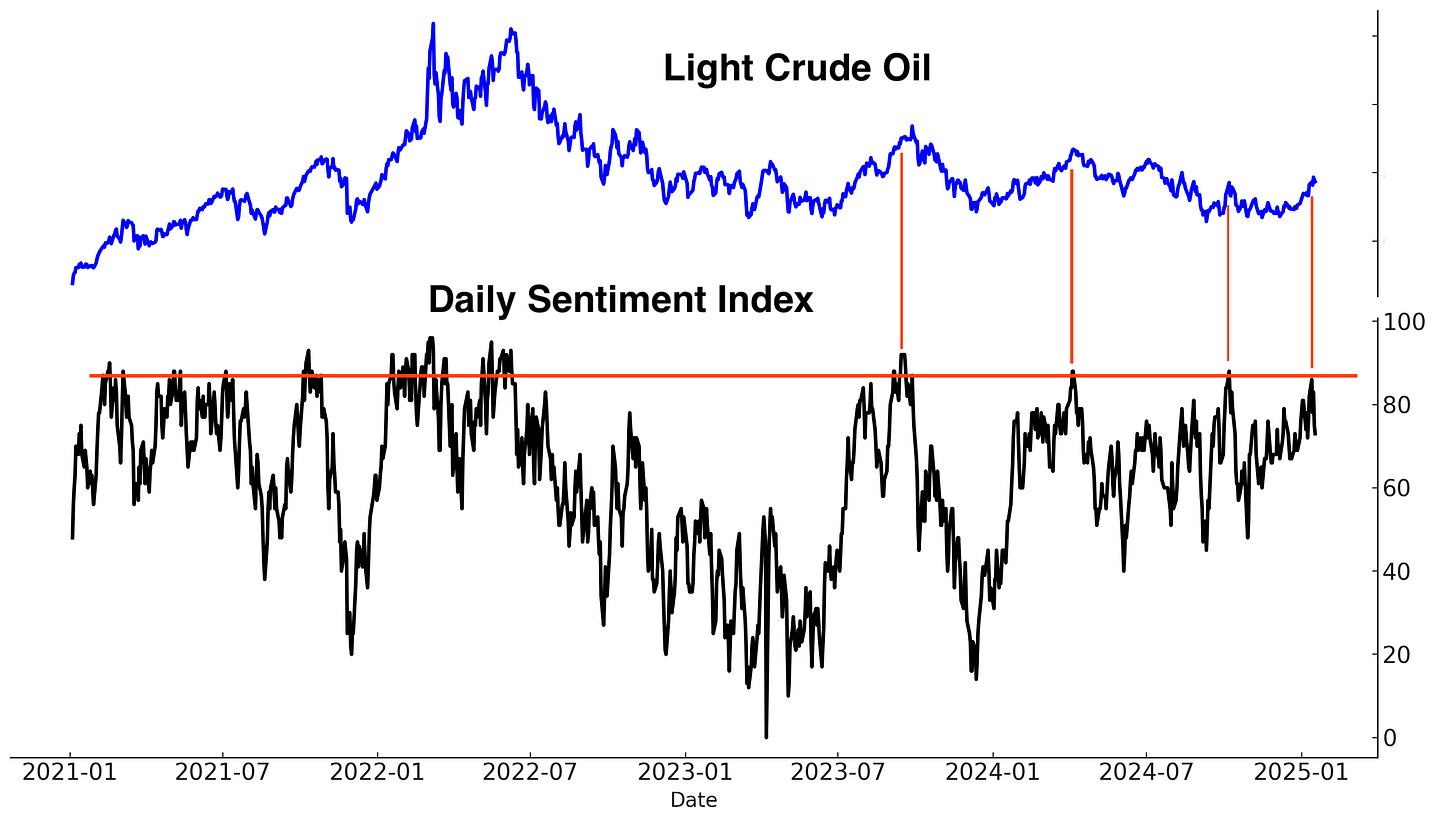
Crude oil’s Daily Sentiment Index has also gone up. The energy sector may continue to rally, but risk:reward does not favor bulls here:
Bond Market
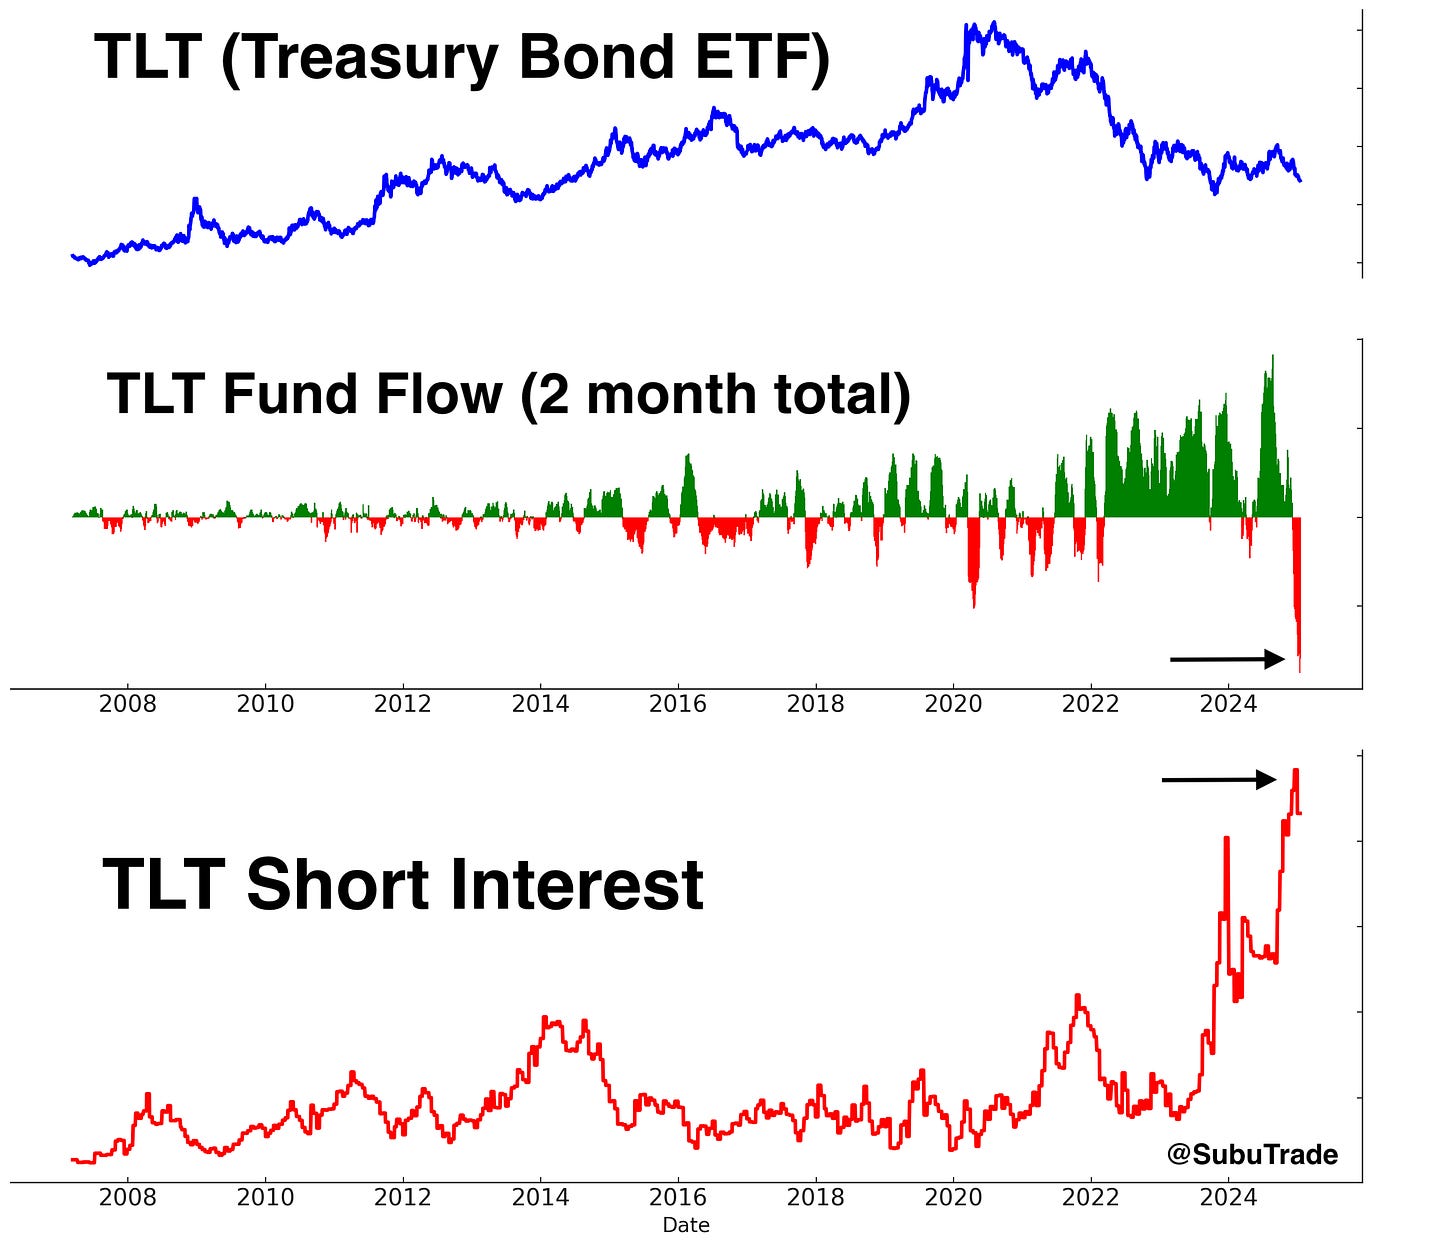
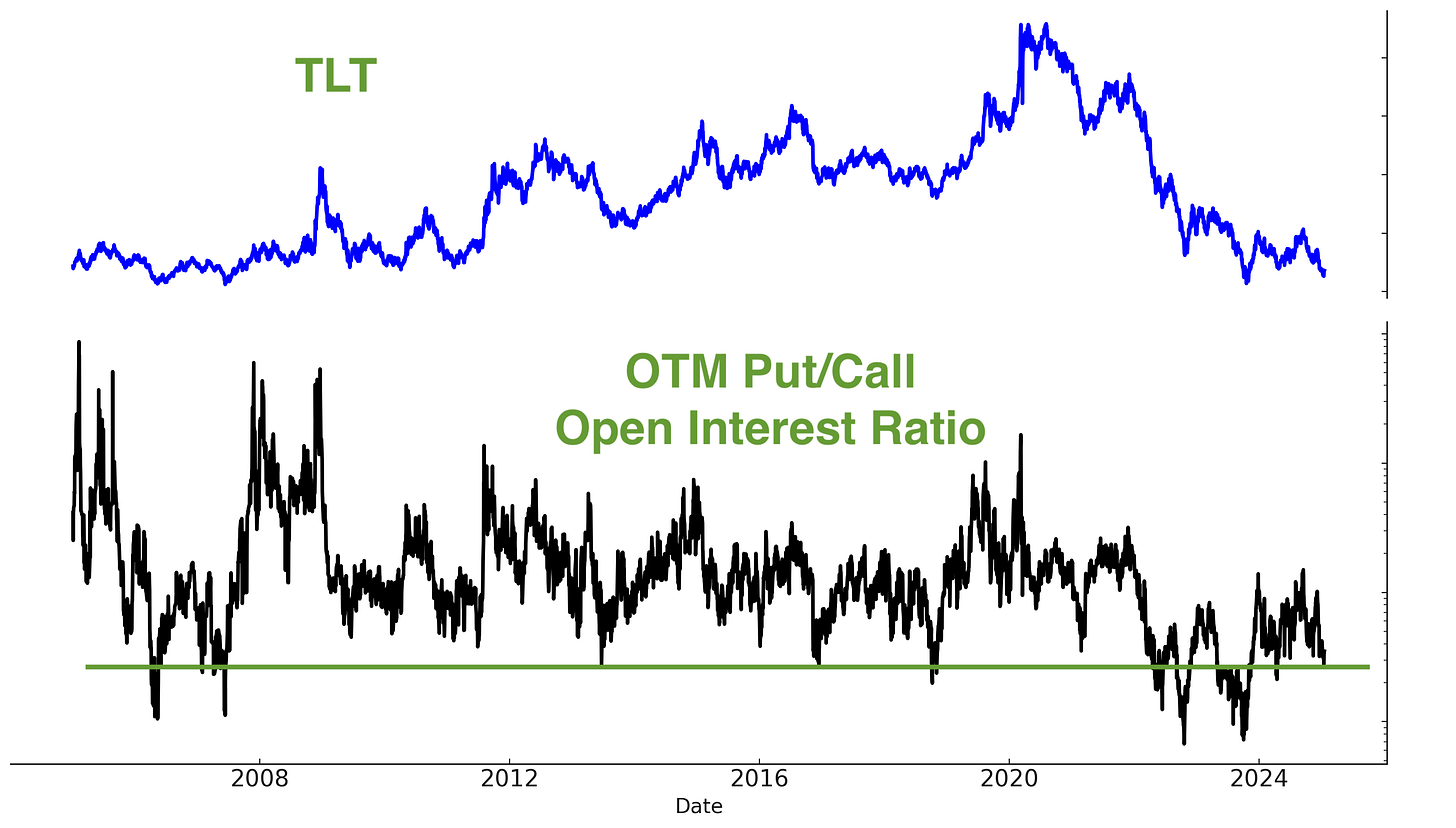
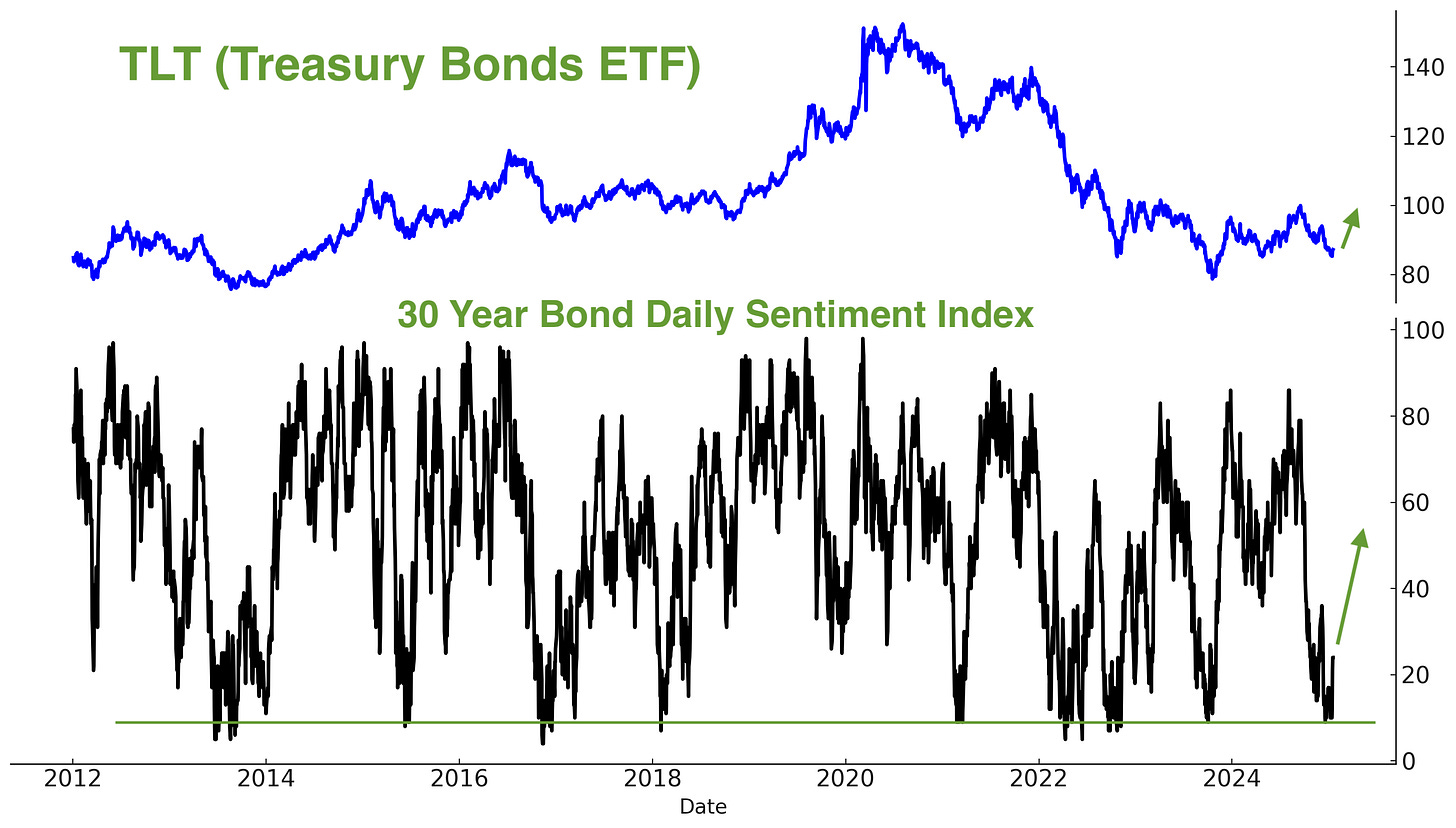
The bond market is driving all other markets right now. Investors and traders are extremely bearish towards bonds, which makes this the perfect candidate for a mean-reversion trade.
As I shared on Twitter/X, the past 2 months have seen record outflows from TLT while short interest is near an all-time high:
TLT’s OTM Put/Call Open Interest Ratio is still extremely low. Bond market bulls have gone through 3 years of epic losses. Will this year finally break that streak of losses?
Here’s another look at the 30 Year Treasury Bond’s Daily Sentiment Index. Still extremely low:
Gold and Silver
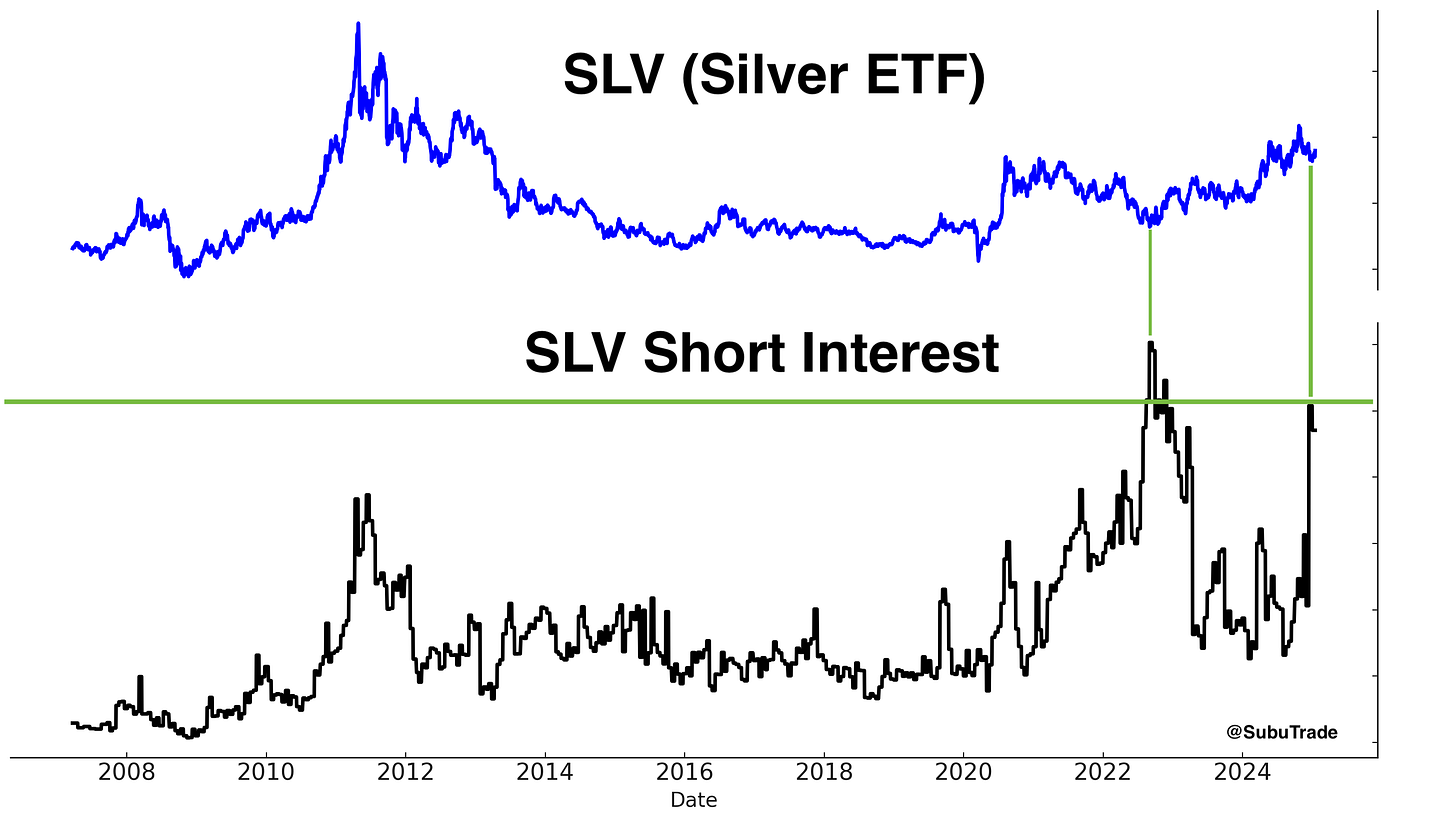
A bond market rally (drop in rates) might also drive gold and silver prices higher. SLV’s short interest is near an all-time high:
India
I am extremely long term bullish on India. India is the world’s fastest growing major economy and the main beneficiary of the U.S.-China economic war.
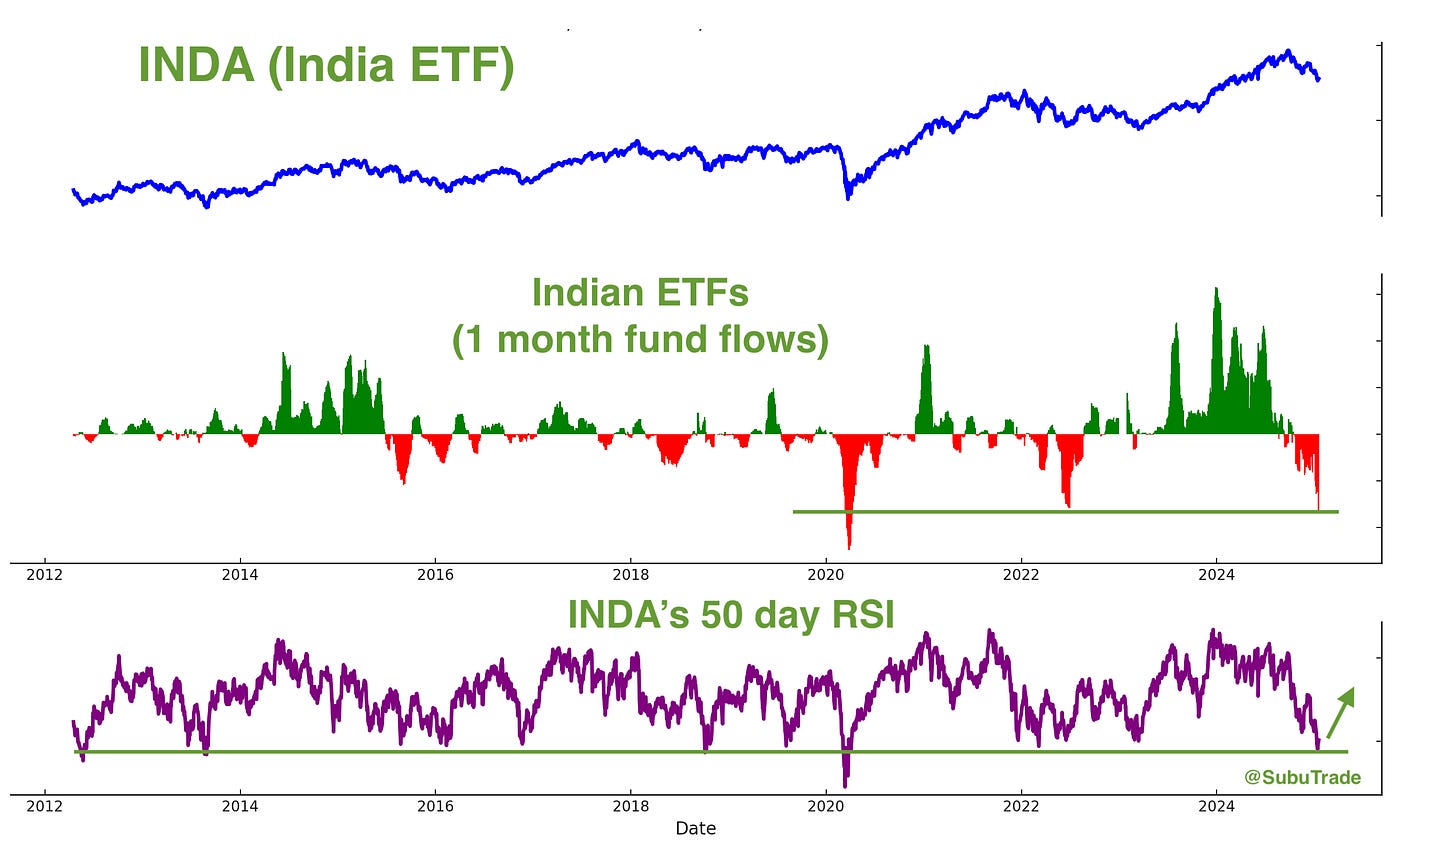
Indian equities have been under pressure recently, with GDP growth slowing a little and the U.S. Dollar rising.
I went long INDA on Friday. This is a mean-reversion play. I’m looking for a multi-week/month bounce.
*If U.S. interest rates drop and the U.S. Dollar pulls back, this will help emerging market equities (priced in U.S. Dollars)
Summary & My portfolio
To summarize:
Core position: long U.S. equities. This core position remains underweight.
SOLD Mean-reversion position (non-core): I sold my long XLE (energy sector ETF) position on Friday. Will explain below.
NEW Mean-reversion position (non-core): long Indian equities. I’m looking for at least a multi-week rally here.
Mean-reversion position (non-core): still long TLT. I’m looking for a multi-week rally here.
Black swan position (non-core): long Chinese equities using call options.
I will end this week’s market report with an interesting piece of news, as it pertains to my long China position:





Hello! Can you explain what a “multi-week” means in this context?
Thks!!!
Many thanks for the report, useful and interesting as usual. As an EU-based investor and trader I would appreciate your view on European equities very much! The trade-off between equities (priced in USD) up and dollar down begins to matter for Euro portfolios...